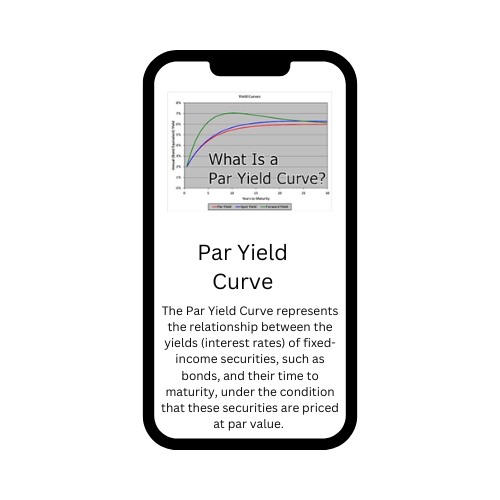
The Par Yield Curve represents the relationship between the yields (interest rates) of fixed-income securities, such as bonds, and their time to maturity, under the condition that these securities are priced at par value. A bond is said to be priced at par when its market price equals its face value. The par yield is the coupon rate at which a bond would be issued today to trade at par, given current market conditions. This curve is commonly derived from the yields of coupon-paying bonds, adjusted for the prevailing market discount rates. The par yield curve is a critical tool in finance, as it is used for pricing new bond issuances, performing interest rate risk management, and constructing more advanced financial models like the zero-coupon yield curve or forward rate curve. It is particularly useful for understanding the interest rate environment and serves as a benchmark for comparing other yield curves, such as spot or forward curves.
Why is it Important in Finance?
The Par Yield Curve is important in finance because it serves as a foundational tool for assessing and comparing the interest rate environment across different maturities. It plays a critical role in bond pricing, as it reflects the coupon rates at which bonds can be issued at par value under current market conditions. Financial institutions and investors use the par yield curve to evaluate the relative value of fixed-income securities, estimate fair yields for new bond issuances, and benchmark their portfolios. Additionally, it is instrumental in constructing related yield curves, such as the zero-coupon yield curve and the forward rate curve, which are used in advanced valuation models and risk management. Central banks and policymakers also rely on the par yield curve to gauge economic conditions, as changes in its shape (e.g., steepening, flattening, or inverting) can signal shifts in growth expectations, inflation, and monetary policy outlook. Overall, the par yield curve provides a transparent and standardized framework for understanding interest rate dynamics, making it indispensable in financial analysis and decision-making.
Understanding the Components of the Par Yield Curve
The Yield of Bonds
A bond yield refers to the return an investor expects to earn from holding a bond until maturity. The yield is influenced by various factors, including interest rates, the creditworthiness of the issuer, and the bond’s maturity.
Par Value and Market Value
The par value of a bond is the amount that the issuer promises to pay the bondholder at maturity. The market value, on the other hand, is the current price at which the bond is trading. For the Par Yield Curve, we assume that bonds are priced at their par value, meaning they are trading at face value.
Interest Rates and Their Relationship
The yield curve is directly impacted by interest rates. When interest rates rise, bond prices fall, and vice versa. The Par Yield Curve helps visualize this relationship across different maturities, providing insight into how the market anticipates future interest rate changes.
How is the Par Yield Curve Constructed?
The Role of Government Bonds
To create the Par Yield Curve, government bonds are typically used as they are considered low-risk and are widely traded. These bonds serve as a benchmark for comparing other bonds with similar maturities.
Time to Maturity and Par Yield
The time to maturity is another key factor. The Par Yield Curve plots the yields of bonds against their time to maturity, from short-term to long-term bonds. The shape of the curve reveals how yields change with time.
The Significance of Yield to Maturity (YTM)
Yield to Maturity (YTM) is the total return an investor can expect to earn if the bond is held to maturity. This yield takes into account the bond’s coupon payments, its purchase price, and the time to maturity. YTM plays a significant role in determining the Par Yield Curve.
Types of Yield Curves
- Normal Yield Curve: A curve that slopes upward, indicating that longer-term securities have higher yields compared to shorter-term ones. It reflects expectations of economic growth and rising inflation over time.
- Flat Yield Curve: Occurs when short-term and long-term yields are approximately equal. This can signal economic uncertainty or a transition in monetary policy.
- Inverted Yield Curve: A downward-sloping curve where short-term yields exceed long-term yields. It is often viewed as a predictor of economic recession.
- Steep Yield Curve: An exaggerated upward slope, where the difference between short-term and long-term yields is significantly large. This typically indicates strong economic growth expectations.
- Humped (Bell-Shaped) Yield Curve: A rare curve where yields increase with maturity up to a certain point and then decline for longer maturities. It may indicate market concerns about long-term economic performance.
What Does the Par Yield Curve Tell Us?
- Interest Rate Levels: The par yield curve provides the coupon rates at which bonds of various maturities would trade at par, reflecting the prevailing interest rate environment.
- Economic Conditions: The shape of the curve (normal, flat, or inverted) offers insights into market expectations for economic growth, inflation, and central bank policies.
- Risk and Return Dynamics: It highlights the trade-off between time and yield, showing how investors demand higher returns for longer-term investments due to risks like inflation and uncertainty.
- Bond Pricing Benchmark: It serves as a reference for pricing new bonds and assessing whether existing bonds are trading at a premium, discount, or par in the market.
- Yield Curve Movements: Changes in the curve over time can indicate shifts in monetary policy, such as interest rate hikes or cuts, and market sentiment regarding future economic conditions.
Factors That Affect the Par Yield Curve
- Monetary Policy: Central bank actions, such as interest rate changes and quantitative easing or tightening, significantly influence the par yield curve by affecting short-term and long-term rates.
- Inflation Expectations: Anticipated inflation impacts yields, as investors demand higher returns for longer maturities to compensate for the erosion of purchasing power.
- Economic Growth Outlook: Strong growth expectations typically steepen the curve, while weak or negative growth expectations may flatten or invert it.
- Supply and Demand for Bonds: Increased issuance of bonds (e.g., by governments or corporations) can raise yields, while high investor demand for safe assets can lower them.
- Credit Risk Perception: Changes in the perceived creditworthiness of bond issuers, including sovereign or corporate entities, can alter the yields required by investors.
- Global Financial Conditions: International interest rate movements, currency fluctuations, and geopolitical events influence local yield curves, especially in interconnected economies.
Interpreting the Par Yield Curve
Interpreting the Par Yield Curve involves analyzing its shape and movement to derive insights about market conditions, economic outlook, and investor sentiment. A normal upward-sloping curve suggests that investors expect steady economic growth and moderate inflation, with higher returns demanded for long-term bonds due to increased risk over time. A flat curve indicates uncertainty or a transition period, often associated with changing monetary policies. An inverted curve, where short-term yields exceed long-term yields, is commonly interpreted as a warning of potential economic recession or deflationary pressures. Steep curves may signal robust growth expectations or aggressive monetary easing. The curve’s slope and shifts over time reflect changing expectations about interest rates, inflation, and economic performance. It also highlights investor preferences for risk and liquidity, making it a key tool for decision-making in bond issuance, portfolio management, and monetary policy analysis. By studying the par yield curve, investors and policymakers can better understand the complex interplay between market forces and economic trends.
Real-World Examples of the Par Yield Curve
Real-World Examples of the Par Yield Curve demonstrate its practical application in understanding financial markets and guiding economic decisions. For instance, during periods of economic expansion, such as the mid-2000s, the par yield curve often displayed a normal upward slope, reflecting investor confidence in growth and higher future interest rates. Conversely, in the lead-up to the 2008 financial crisis, the par yield curve inverted, signaling market concerns about an impending recession as short-term rates exceeded long-term rates. Similarly, during quantitative easing programs initiated by central banks (e.g., the Federal Reserve after 2008 or during the COVID-19 pandemic in 2020), the par yield curve steepened due to lower short-term rates and market expectations of rising long-term inflation. Governments also use the curve to determine the cost of issuing debt, such as the U.S. Treasury issuing bonds with different maturities to fund fiscal stimulus programs. Additionally, financial institutions rely on the curve to assess the cost of funding versus investment returns, impacting mortgage rates, corporate bond pricing, and bank lending strategies. These examples highlight the par yield curve’s role as a barometer for market sentiment and an indispensable tool for economic and financial planning.
Limitations of the Par Yield Curve
- Assumption of Par Pricing: The curve assumes bonds are priced at par value, which may not reflect the actual market prices of many securities, leading to discrepancies in analysis.
- Dependence on Market Data: The par yield curve is derived from actively traded bonds, and any illiquidity or lack of data for certain maturities can distort the curve’s accuracy.
- Exclusion of Zero-Coupon Bonds: It does not directly account for yields from zero-coupon bonds, which are critical for constructing more precise yield curves like the zero-coupon or spot yield curve.
- Simplistic View: The curve does not incorporate factors like reinvestment risk, tax considerations, or the impact of embedded options (e.g., callable or putable bonds), which affect real-world yields.
- Dynamic Market Conditions: The curve reflects current market conditions but does not directly account for expected future interest rate changes, making it less predictive in volatile markets.
Conclusion
In conclusion, the Par Yield Curve is a fundamental tool in finance, offering critical insights into interest rate dynamics, bond pricing, and economic conditions. By reflecting the coupon rates at which bonds trade at par value across various maturities, it serves as a benchmark for market participants, including investors, issuers, and policymakers. While it provides valuable information about the cost of borrowing and the return on investments, its utility extends beyond individual transactions to include broader applications in monetary policy, risk management, and economic forecasting. However, the par yield curve is not without limitations, as it relies on market data, assumes par pricing, and may not fully capture complex factors like reinvestment risk or future interest rate movements. To make well-informed decisions, users must interpret the curve in conjunction with other analytical tools and consider the broader economic and market context. Despite its constraints, the par yield curve remains an indispensable component of financial analysis, enabling a deeper understanding of the intricate relationship between time, risk, and return in fixed-income markets.
