The evening star Candlestick pattern is one of the patterns of price action trading. Technical analysts utilize the evening star pattern on stock price charts to determine when a trend is ready to change direction. Three candles make up the bearish candlestick pattern: a red candle, a small-bodied candle, and a huge white candlestick.
Introduction
A candlestick pattern is a method of condensing the presentation of specific stock information. It depicts the stock’s open, high, low, and closing prices over a specific time frame.
A candle and two wicks are included in each candlestick. The difference between the highest and lowest price during that trading day determines the candle’s length. A long candle denotes a significant price move, whereas a short candle denotes a minor one. To put it another way, lengthy candlestick bodies indicate strong buying or selling pressure, depending on which way the trend is moving, whilst short candlesticks show little change in price.

What is the evening star candlestick Pattern?
A good sign that a downhill trend has started is the evening star pattern. However, it can be challenging to make out in the shuffle of stock-price data. Traders frequently utilize price oscillators and trendlines to confirm whether an evening star pattern has actually formed, helping to properly identify it.
Even though it is very common among traders, there are other bearish signs as well. The bearish harami, the black cloud cover, the shooting star, and the bearish engulfing are further bearish candlestick patterns. When trying to spot trend changes, different traders will have different preferences for the patterns to look out for.
Formation of Evening Star Candlestick Pattern
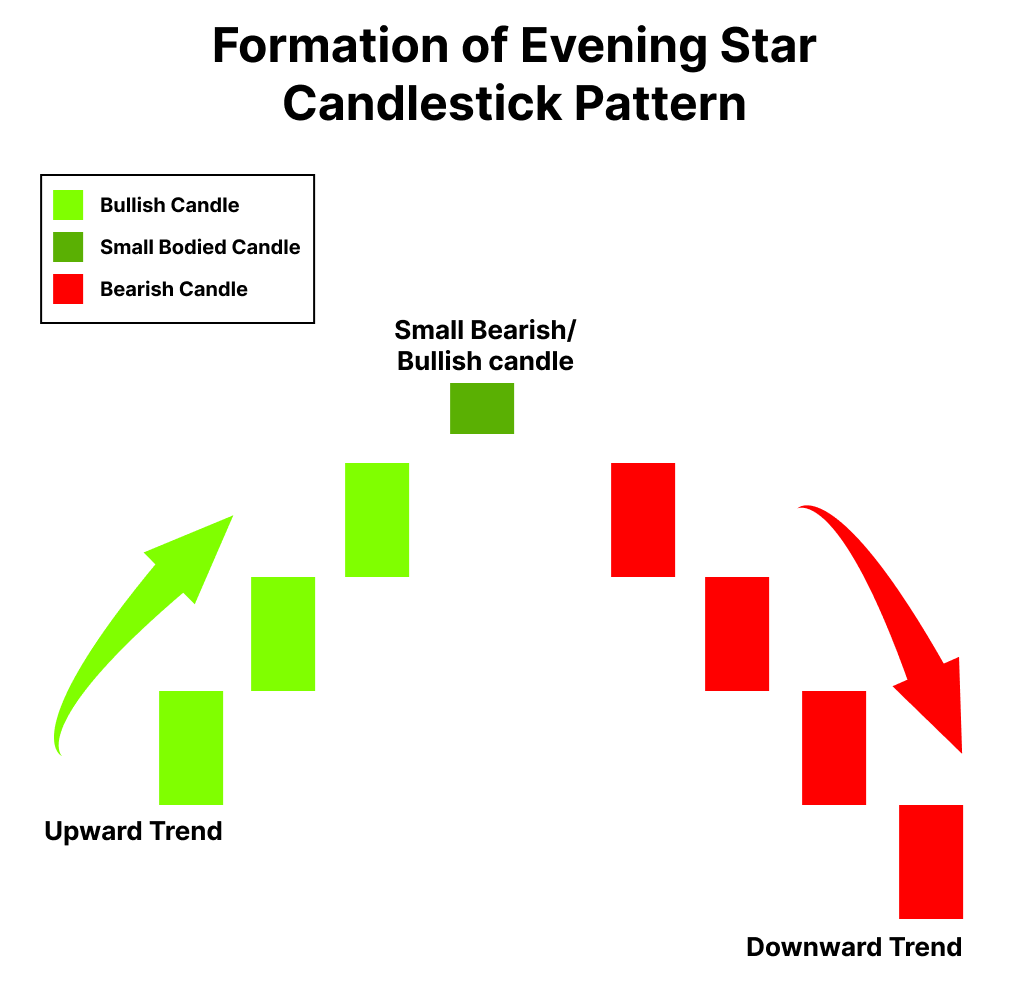
The first of the three days is represented by a lengthy white candle, which shows that there has been strong purchasing pressure driving prices higher. Price increases are also visible on the second day, however, they are less pronounced than on the first day. Last but not least, the third day displays a lengthy red candle, indicating that selling pressure has driven the price to about the first day’s midway.
How to Trade Evening Star Patterns with Examples?
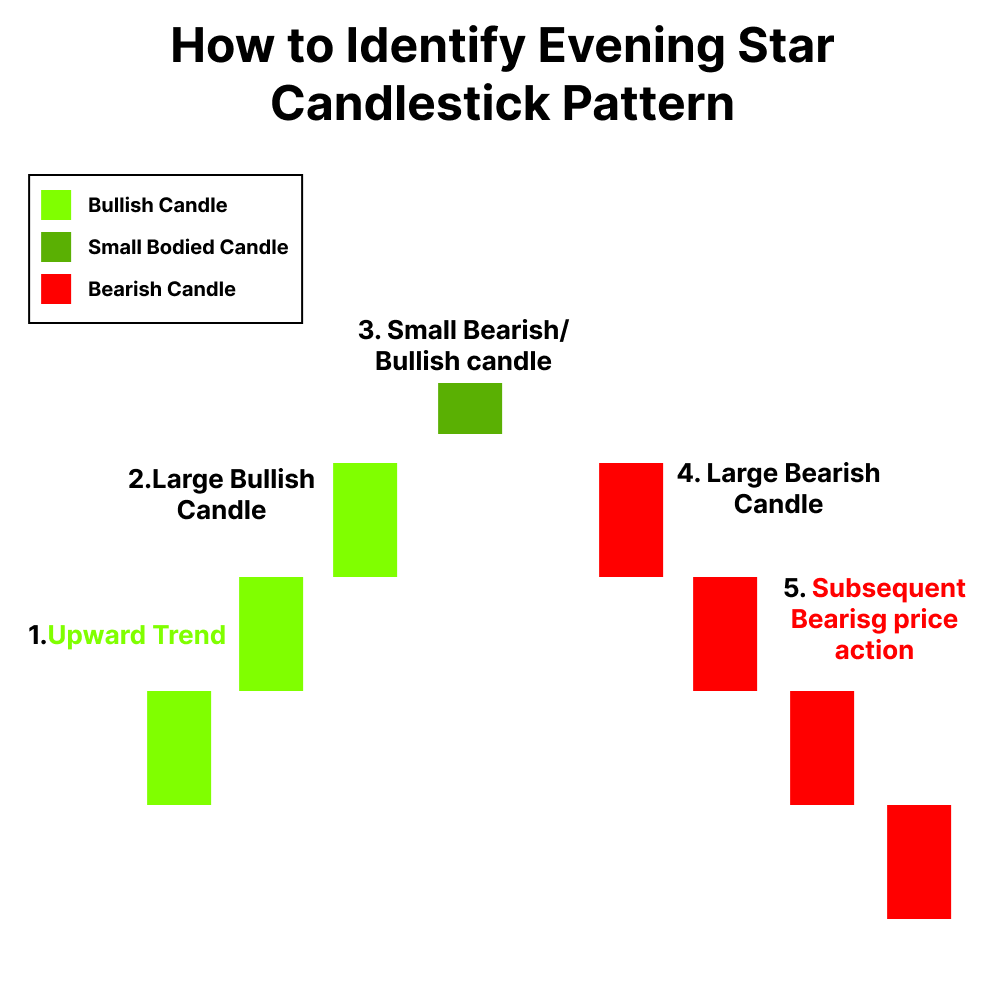
- With the market on an uptrend, the bulls are in complete control.
- The market/stock hits new highs while it is on an uptrend.
- As anticipated, the market opens high on the first day of the pattern (P1), sets a new high, and closes close to the day’s high. Day 1’s (P1) long green candle indicates an increase in buying
- The market begins with a gap on the pattern’s second day (P2), reiterating the bullish posture in the market. The market/stock does not move after the positive opening, though, and closes by producing a doji or spinning top. For bulls, the closure on P2 causes a small amount of panic.
- The market opens with a gap down and proceeds into a red candle on the third day of the pattern (P3). The lengthy red candle is a sign that the sellers are gaining the upper hand. The price movement on P3 sends the bulls into a tailspin.
- It is anticipated that the bulls will continue to panic, which will result in continued bearishness during the coming trading sessions. As a result, one should consider opportunities for shorting.
Strength and Weakness of Evening star Pattern?
When evaluating an indicator, The Evening Star, like the majority of candlestick patterns, should be evaluated in light of the current trend and whether there is evidence to support the trade. The entry and exit points of the evening star pattern are well-defined and simple to spot. However, a crucial drawback is the likelihood of failure, which means the price could increase more.
Conclusion
If the third candlestick opens below the actual star, leaving a space between the actual star and the third candlestick, the evening star’s accuracy is improved. But this happens quite infrequently. The degree to which the third candlestick’s real body penetrates the first candlestick’s real body and whether the third candlestick has little to no lower shadow also contribute to reliability. The pattern is more dependable if the volume on the first candlestick is lower and the volume on the third candlestick is higher, therefore volume should also be taken into account.