- Study
- Slides
- Videos
9.1 Introduction
Discounted cashflow (DCF) valuation views the intrinsic value of a security as the present value of its expected future cash flows. When applied to dividends, the DCF model is the discounted dividend approach or dividend discount model (DDM). DCF analysis can also be used to value a company and its equity securities by valuing free cash flow to the firm (FCFF) and free cash flow to equity (FCFE). Whereas dividends are the cash flows actually paid to stockholders, free cash flows are the cash flows available for distribution to shareholders.
Unlike dividends, FCFF and FCFE are not readily available data. Analysts need to compute these quantities from available financial information, which requires a clear understanding of free cash flows and the ability to interpret and use the information correctly. Forecasting future free cash flows is also a rich and demanding exercise. The analyst’s understanding of a company’s financial statements, its operations, its financing, and its industry can pay real “dividends” as he addresses that task.
9.2 When Is this used
Analysts like to use free cash flow as the return (either FCFF or FCFE) whenever one or more of the following conditions is present:
-
The company does not pay dividends.
-
The company pays dividends but the dividends paid differ significantly from the company’s capacity to pay dividends.
-
Free cash flows align with profitability within a reasonable forecast period with which the analyst is comfortable.
-
The investor takes a control perspective. With control comes discretion over the uses of free cashflow. If an investor can take control of the company (or expects another investor to do so), dividends may be changed substantially; for example, they may be set at a level approximating the company’s capacity to pay dividends. Such an investor can also apply free cash flows to uses such as servicing the debt incurred in an acquisition.
Common equity can be valued directly by using FCFE or indirectly by first using an FCFF model to estimate the value of the fi rm and then subtracting the value of noncommon – stock capital (usually debt) from FCFF to arrive at an estimate of the value of equity.
9.3 Defining Free Cashflows
Free cashflow to the firm is the cashflow available to the company’s suppliers of capital after all operating expenses (including taxes) have been paid and necessary investments in working capital (e.g., inventory) and fi xed capital (e.g., equipment) have been made. FCFF is the cash flow from operations minus capital expenditures. A company’s suppliers of capital include common stockholders, bondholders, and sometimes, preferred stockholders. The equations analysts use to calculate FCFF depend on the accounting information available.
Free cash flow to equity is the cash flow available to the company’s holders of common equity after all operating expenses, interest, and principal payments have been paid and necessary investments in working and fixed capital have been made. FCFE is the cash flow from operations minus capital expenditures minus payments to (and plus receipts from) debt holders.
9.4 Present Value of Free Cashflow to the Firm
The FCFF valuation approach estimates the value of the firm as the present value of future FCFF discounted at the weighted average cost of capital:
Because FCFF is the cash flow available to all suppliers of capital, using WACC to discount FCFF gives the total value of all of the firm’s capital.
FCFF= Cash flow from Operations – Net Investment in Long Term Assets
The cost of capital is the required rate of return that investors should demand for a cash flow stream like that generated by the company being analysed. WACC depends on the riskiness of these cashflows.
WACC is the weighted average of the after (corporate) tax required rates of return for debt and equity, where the weights are the proportions of the firm’s total market value from each source, debt and equity. As an alternative, analysts may use the weights of debt and equity in the firm’s target capital structure when those weights are known and differ from market value weights.
The formula for WACC is:
WACC= Wd*Kd+ We*Ke
Where:
Wd= Weight of Debt (proporotion of debt in total assets)
Kd= Rate of debt
We= Weight of Equity (proporotion of equity in total assets)
Ke= Rate of Equity
So, Lets calculate the Free cashflow of the firm of Britannia Industries:
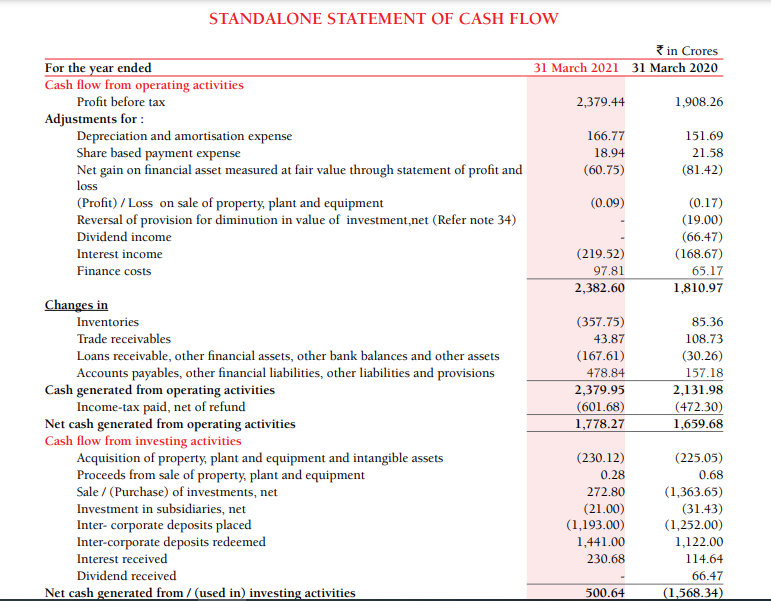
Free Cashflow for FY21 = Net Cash Generated from Operating activities- Capital Expenditure
= 1778.27-230.12
= Rs. 1547.88crs
Free Cashflow for FY20= 1659.68-225.05
= Rs. 1434.63 crs
9.5 Calculating Present Value Using Free Cashflow Approach
Lets understand from this how will be calculate the present value of the firm using this approach
Step 1- Calculate the avg free cashflow- So avg of FY21 & FY20 = Rs.1491.25crs
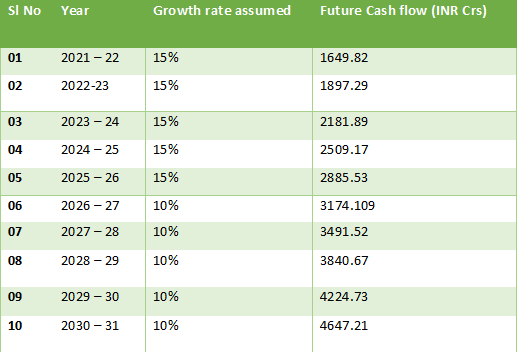
Step 2- Identify the growth rate- Select a rate of growth. This is the rate at which the average cash flow will grow going forward. We could use the two stage model here. The first stage deals with the first 5 years, and the 2nd stage deals with the last 5 years. Specifically, for Britannia, since it’s a large consumer goods company- more mature- we can assume 15% for the first 5 years and around 10% for the next five years.
Step 3- Estimating the future cashflow for next 10 years
We know the average cash flow for 2020 -21 is Rs.1434.63 Crs. At 15% growth, the cash flow for the year 2021 – 2022 is estimated to be
= 1434.63 * (1+15%)
= Rs. 1649.8 Crs.
The free cash flow for the year 2022 – 2023 is estimated to be –
= 1649.8 * (1 + 15%)
= Rs. 1897.27 Crs.
So on and so forth.
Step 4- Calculate the Terminal Value
After we have predicted the cashflow for 10 years. What would happen to the company after the 10th year? Would it cease to exist? Well, it would not. A company is expected to be a ‘going concern’ which continues to exist forever. This implies that as long as the company exists, some amount of free cash is generated. However, as companies mature, the rate at which free cash is generated starts to diminish.
The rate at which the free cash flow grows beyond 10 years (2031 onwards) is called the “Terminal Growth Rate”. Usually, the terminal growth rate is considered to be less than 5%.
To calculate the terminal value, we just have to take the cash flow of the 10th year and grow it at the terminal growth rate. However, the formula to do this is different as we are calculating the value literally to infinity.
Let us calculate the terminal value for Britannia considering a discount rate of 10% and terminal growth rate of 4% :
Terminal Value = FCF * (1 + Terminal Growth Rate) / (Discount Rate – Terminal growth rate)
= 4647.21 *(1+ 4%) / (9% – 4%)
= 96,661.97
Step 5- Calculate the present value of these cashflows and the terminal value
Lets assume the discount rate of 9%
For example, in 2022 – 23 (2 years from now), Britannia is expected to receive Rs.195.29 Crs. At a 9% discount rate, the present value would be –
= 1897.29 / (1+9%)^2
= Rs.1596.91 Crs
We also need to calculate the net present value for the terminal value.
Terminal Value is 96661.97 so NPV= 96661.97/(1+9%)^10
= Rs.40831crs
Therefore, the sum of the present values of the cash flows is = NPV of future free cash flows + PV of terminal value
= 18086+ 40831
= Rs.58917 Crs
This means standing today and looking into the future; Britannia industries could generate a totally free cash flow of Rs.58917 Crs.
Now to compare this with the Market Cap of the firm- we should check the net debt of the company.
Net debt= Current Year total debt- Cash & Cash equivalent
= Rs.1719.67crs
So total present value of the cash flow = Rs.58917-1719= Rs.57198crs
Market cap of Britannia is Rs.89922 crs. That means using the DCF model and above assumption- the stock looks over value. However these numbers can change if one changes the terminal value growth rate or the discount factor.
9.6 Present Value of FCFEE
The value of equity can also be found by discounting FCFE at the required rate of return on
equity, r :
Because FCFE is the cashflow remaining for equity holders after all other claims have been satisfied, discounting FCFE by r (the required rate of return on equity) gives the value of the firm’s equity.
FCFE= Cashflow from operations- capital expenditure+ Net borrowing
Lets calculate this for britannia industries:
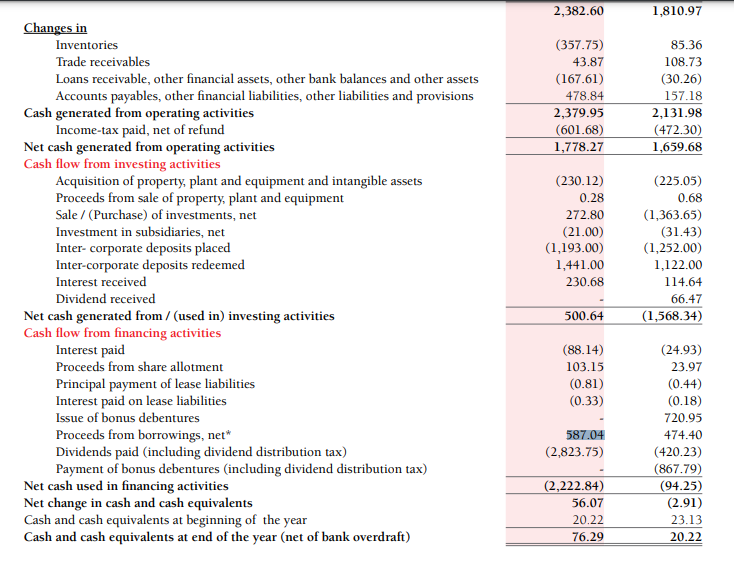
So FCFE for FY21 would be= Net cashfllow from operating activities- Capex + net borrowing
= 1778.27-230.12+587.04
= Rs.2135.19crs
Now if we estimate the future cashflow using this number as the base and calculate the present value later for the forecasted number. The value we would arrive at would be called as the free cashflow to equity shareholders. Here also we can have- Constant growth rate, two stage and three stage growth models to arrive at the future values of these cashflows.


