- Study
- Slides
- Videos
2.1 Introduction
The Wave Principle was Ralph Nelson Elliott’s discovery of how social or crowd behavior trends and reverses in recognizable patterns. It is a detailed description of how financial markets behave. The description reveals that there is a PSYCHE OF THE CROWD inherent in all representative financial market series. The crowd is not a physical crowd but a psychological crowd. It constantly moves from pessimism to optimism, from fear to greed and from euphoria to panic and back in a natural psychological sequence, creating specific patterns in price movements.
This concept of recursive patterns across finer and finer scales in the financial markets (their fractal nature), was proposed by Elliott in the 1930s, which antedates today’s formal study of non-linear dynamics and chaos. The main point emerging from the Elliott Wave concept is that markets have a form (pattern). It is here that the investor finds determinism in a seemingly random process.
Elliott discovered what the main initiator of the chaos theory, Benoit Mandelbrot, confirmed 50 years later in collaboration with Henry Houthakker, an economics professor at Harvard: that patterns made by taking very short-term “snapshots” of stock prices, for example, every day are similar to patterns formed by snapshots taken once a week, or once a month, or even once a year. Elliott isolated thirteen patterns. He cataloged them and explained that they link together, and where they are likely to occur in the overall path of the market development.
2.2 Details of Wave
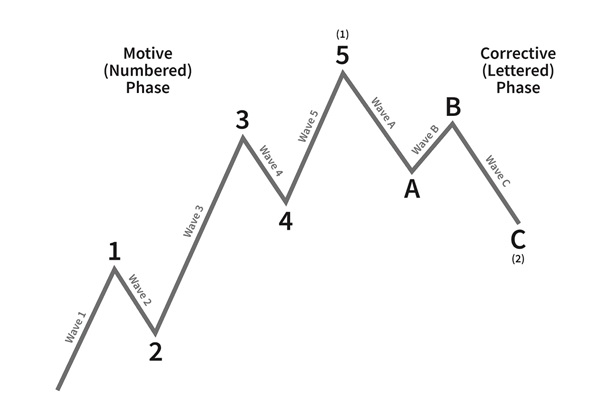
The basic pattern shows that markets move forward in a series of 5 waves of psychological development (from pessimism to optimism). When these 5 forward waves are complete, a reaction sets in, taking place in 3 waves (from optimism to pessimism).
In the charts below- Numbers are used in the diagram are used to designate “5-wave” patterns, and letters to designate “3-wave” patterns. These 8 waves then complete a cycle from which a new series of 5 waves commences, to be followed by another set of 5 waves. And finally, after two sets of 5 waves (1) and (3) and two sets of three wave patterns (2) and (4), a final set of 5 waves materializes and completes the whole pattern.
At this point, after wave (5) is complete, there is now a set of 3 waves (a), (b) and (c) of greater magnitude than the two previous corrections. This set would correct the whole of the 5 upward waves, which themselves had each broken into 5 and 3 smaller waves along the way.
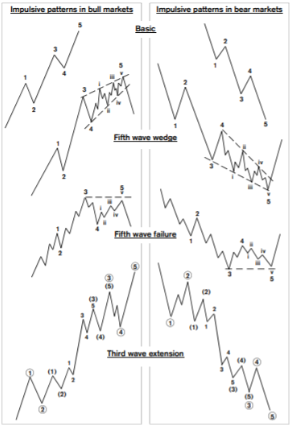
Catalog of the Impulsive Waves
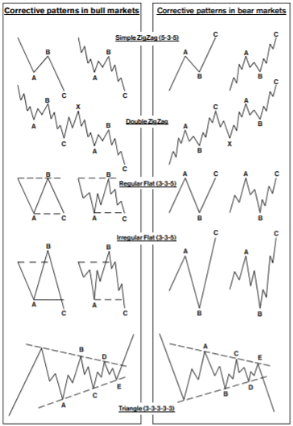
Catalog of corrective patterns
2.3 Understanding the Elliot Wave Theory
To comprehend the Elliott Wave Theory fully, it is essential to grasp the concept of wave structures and their significance in determining market behavior. The theory proposes that waves are fractal, meaning they can be observed across multiple timeframes and are present within larger wave patterns. This fractal nature allows traders to analyze market movements at different scales, from short-term charts to long-term trends.
The Elliott Wave Theory classifies waves into two broad categories: motive and corrective. Motive waves are further divided into impulse waves and diagonal waves. Intense, trending moves in the direction of the primary trend characterize impulse waves. They consist of five smaller waves—three in the order of the movement (termed “impulse waves”) and two against the trend (known as “corrective waves”).
On the other hand, corrective waves aim to correct the price movement of impulse waves. These waves move against the trend and consist of three smaller waves. Corrective waves are labeled A, B, and C and can take various forms, such as zigzags, flats, or triangles. By identifying these wave structures and their position within the larger pattern, traders can gain insights into potential price reversals or continuations.
2.4 How Elliot Waves Work
Elliott Waves work by providing traders and investors with a framework to understand the psychology behind market movements. The theory suggests that the first two impulse waves (1 and 3) represent periods of optimism as prices rise due to increased buying pressure. Wave 2 is a corrective wave that retraces part of the initial uptrend, leading to a temporary decline.
The third impulse wave (Wave 3) is typically the longest and strongest, representing the most optimistic phase of the market cycle. Prices rise significantly during this wave, often surpassing the peak of the first wave. Wave 4 serves as a corrective wave, retracing some of the gains in Wave 3. Finally, Wave 5 completes the motive phase of the market cycle and signifies a price peak.
After the five-wave impulse pattern, the market enters a corrective phase consisting of three waves (A, B, and C). Wave A is a countertrend move against the primary trend, followed by Wave B, which partially retraces Wave A. The final wave, Wave C, moves toward the primary trend and completes the correction.
2.5 Impulse Waves
Impulse waves are the backbone of the Elliott Wave Theory. They represent the directional movement of a trend and consist of five smaller waves. These waves are labeled as 1, 2, 3, 4, and 5 and follow a specific structure. Waves 1, 3, and 5 move toward the primary trend, “impulse waves.” Waves 2 and 4 are corrective waves that retrace a portion of the previous impulse wave.
The first impulse wave (Wave 1) starts a new trend and is often characterized by a strong move in price. Wave 2 follows as a corrective wave that retraces part of the gains made in Wave 1. Wave 3 is typically the strongest and most extended impulse wave. It represents a decisive move in the direction of the primary trend, often exceeding the starting point of Wave 1.
Wave 4 is a corrective wave that retraces some of the gains made in Wave 3. It is important to note that Wave 4 should only retrace up to the ending point of Wave 1. Finally, Wave 5 completes the impulse wave pattern and is often accompanied by decreasing volume and momentum. Once Wave 5 reaches its peak, a correction is likely to follow.
2.6 Corrective Waves
After the completion of an impulse wave, the market enters a corrective phase. Corrective waves aim to correct the price movement of the previous impulse waves. These waves move against the primary trend and consist of three smaller locks: A, B, and C.
Wave A is the first corrective wave and moves against the trend. It usually retraces a significant portion of the preceding impulse wave. Wave B follows as a corrective wave, but it should not retrace beyond the starting point of Wave A. Wave C completes the correction and moves toward the primary trend. It often extends beyond the ending point of Wave A, leading to a potential trend reversal.
Corrective waves can take different shapes, such as zigzags, flats, or triangles, depending on the market conditions. Zigzags are characterized by sharp moves in one direction, followed by a corrective action in the opposite direction. Flats consist of three waves with a shallow correction in the middle. Triangles are consolidation patterns with overlapping waves.
2.7 Elliot Wave Theory vs. Other Indicators
While various technical indicators are available to traders, the Elliott Wave Theory offers a unique perspective on market analysis. Unlike most indicators that rely on mathematical calculations or price patterns, the Elliott Wave Theory focuses on the psychological aspect of market participants.
One advantage of the Elliott Wave Theory is its ability to provide a long-term outlook on market trends. By identifying wave patterns on larger timeframes, traders can anticipate significant turning points in the market and adjust their strategies accordingly. Additionally, the theory allows for analyzing multiple timeframes simultaneously, providing a comprehensive view of market behavior.
However, it is essential to note that ElliottWave Theory is a subjective form of analysis and requires skill and experience to apply effectively. Identifying and interpreting wave patterns accurately can be challenging, leading to potential errors in calculation. Moreover, the theory needs to be more foolproof and guarantee accurate predictions of future price movements.
When comparing the Elliott Wave Theory to other indicators, it is essential to consider individual trading preferences and goals. Some traders may find value in combining the Elliott Wave Theory with other technical indicators, such as moving averages or oscillators, to validate their analysis and enhance their decision-making process.
2.8 How To Trade Using Elliott Wave Theory?
Trading using the Elliott Wave Theory involves identifying and analyzing wave patterns to make informed trading decisions. Here are a few steps to consider when applying this theory:
- Identify the Trend: Determine the direction of the primary trend by analyzing the wave patterns. Identify the impulse waves and corrective waves to understand the market structure.
- Identify Potential Entry Points: Once the trend is established, look for potential entry points based on completing corrective waves. These points often coincide with support or resistance levels.
- Manage Risk: Implement risk management strategies to protect your capital. Place stop-loss orders to limit potential losses and set profit targets based on the projected price targets.
- Validate with Other Indicators: Consider using additional technical indicators or tools to confirm the signals provided by the Elliott Wave Theory. This can help increase the reliability of your analysis.
- Monitor the Waves: Monitor the market to adjust your analysis as new waves develop. Waves can change their structure or extend beyond initial expectations, requiring adjustments to your trading plan.
- Combine with Fundamental Analysis: Consider incorporating fundamental analysis to complement your technical analysis. Understanding economic indicators, news events, and market sentiment can provide additional insights into potential price movements.
Remember that trading involves risk, and no trading strategy is guaranteed successful. Practicing proper risk management and using the Elliott Wave Theory as part of a comprehensive trading plan is essential.
Conclusion
In conclusion, the Elliott Wave Theory is a widely recognized approach to analyzing financial markets. It offers traders a framework to understand market behavior by identifying repetitive wave patterns. By recognizing impulse and corrective waves, traders can gain insights into potential price reversals or continuations.
It is essential to approach the Elliott Wave Theory cautiously and understand its limitations. While it can provide valuable insights into market trends, there are better methods for predicting future price movements. Successful application of the theory requires experience, skill, and the integration of other technical and fundamental analysis tools.
By incorporating the Elliott Wave Theory into your trading strategy, you can better understand market dynamics and make more informed trading decisions. Remember to practice risk management and continuously refine your analysis to adapt to changing market conditions.


