- Introduction To Technical Analysis
- Charts
- Line & Bar Charts
- Candlestick Patterns
- Support, Resistance & Trend
- Trend Lines
- Understanding Chart Patterns & Head & Shoulder In Detail
- Double Top & Bottom Pattern In Stock Market - Explained
- Saucers & Spikes
- Continuing Patterns
- Know What Is Price Gaps & Its Types In Stock Market
- Study
- Slides
- Videos
5.1 Support & Resistance
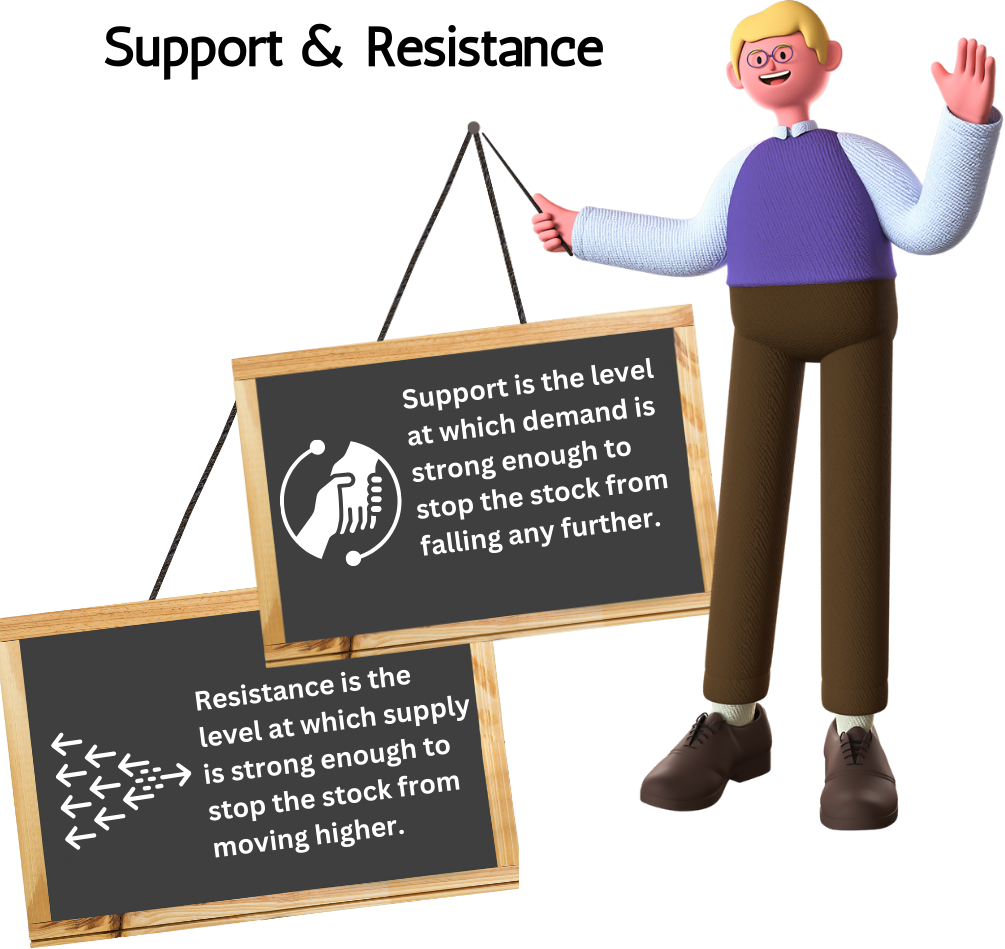
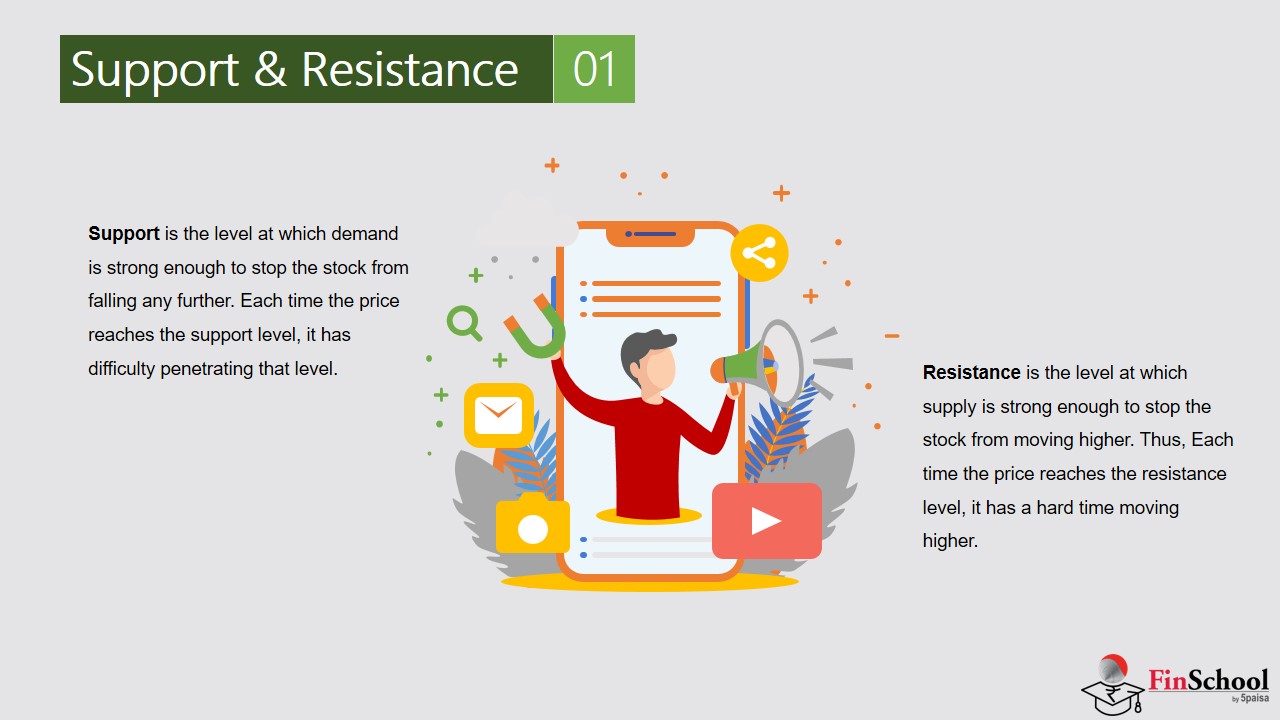
Support is the level at which demand is strong enough to stop the stock from falling any further. Each time the price reaches the support level, it has difficulty penetrating that level. The rationale is that as the price drops and approaches support, buyers (demand) become more inclined to buy and sellers (supply) become less willing to sell.
Resistance is the level at which supply is strong enough to stop the stock from moving higher. Thus, Each time the price reaches the resistance level, it has a hard time moving higher. The rationale is that as the price rises and approaches resistance, sellers (supply) become more inclined to sell and buyers (demand) become less willing to buy.
Support & Resistance Lines
Support and resistance are critical concepts in technical analysis, offering valuable insights into price movements in the stock market. Support represents a price level where demand is strong enough to prevent the price from falling further, essentially acting as a “floor.” Conversely, resistance is a price level where selling pressure prevents the price from rising, creating a “ceiling.” These levels can be identified using support and resistance charts and tools such as a support and resistance indicator, which assist traders in visualizing trends and potential reversal points.
Understanding support and resistance in trading enables investors to determine support and resistance zones, helping them time their entry and exit points effectively. Drawing support and resistance lines or zones requires identifying price levels where the market has consistently reversed in the past. Tools like technical analysis support and resistance or support resistance indicators can simplify this process. Traders often observe candlestick patterns, such as support and resistance candlestick formations, to pinpoint these levels accurately. Knowing how to calculate resistance and support or how to find support and resistance levels is crucial for any trader looking to make informed decisions. Whether you’re trading stocks, commodities, or cryptocurrencies, mastering support level technical analysis and identifying strong support and resistance can significantly enhance your trading strategy.
The levels of resistance and support represent critical junctures where supply and demand interact. These support and resistance levels are seen by technical analysts as crucial when determining market psychology and supply and demand. When these support or resistance levels are broken, the supply and demand forces that created these levels are assumed to have moved, in which case new levels of support and resistance will likely be established.
5.2 Support And Resistance Role Reversal
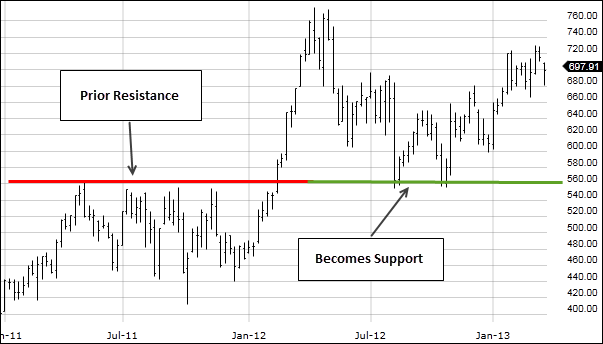
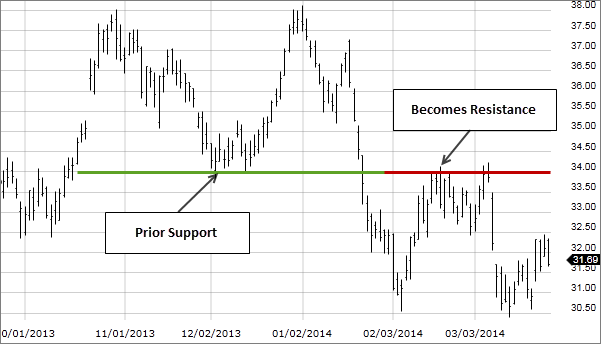
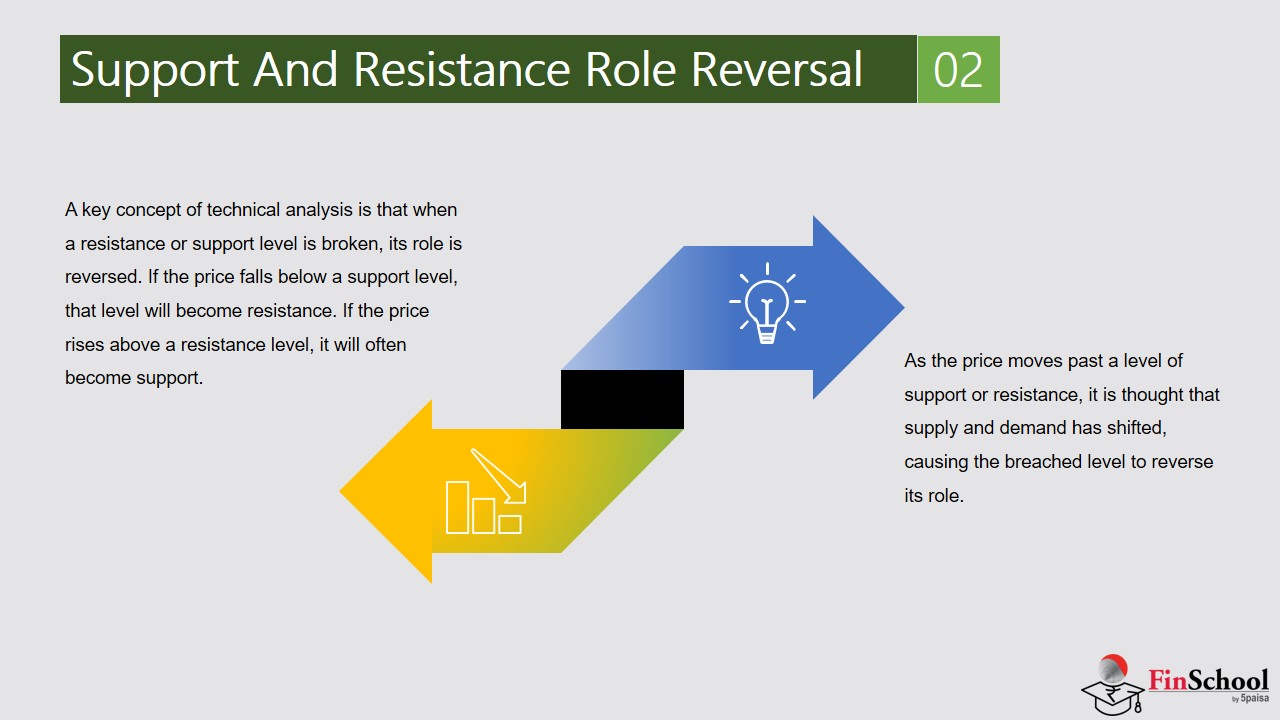
A key concept of technical analysis is that when a resistance or support level is broken, its role is reversed. If the price falls below a support level, that level will become resistance. If the price rises above a resistance level, it will often become support. As the price moves past a level of support or resistance, it is thought that supply and demand has shifted, causing the breached level to reverse its role.
Example Of Resistance Becoming Support
Example Of Support Becoming Resistance
5.3 Why Do Support And Resistance Lines Occur?
A stock’s price is determined by supply and demand. Bulls buy when the stock’s prices are too low and bears sell when the price reaches its maximum. Bulls increase the prices by increasing the demand and bears decrease it by increasing the supply. The market reaches a balance when bulls and bears agree on a price.
When prices are increasing upward, there exists a point at which the bears become more aggressive the bulls begin to pull back – the market balances along the resistance line. When prices are going downwards, the market balances along the support line. As prices starts to decline toward the support line, buyers become more inclined to buy and sellers start holding on to their stocks. The support line marks the point where demand takes precedence over supply and prices will not decrease below that support line. The reverse holds true for a resistance line.
Prices often break through support and resistance lines. A breakthrough a resistance line shows that the buyers have won out over the sellers. The price of the stock is bid higher than the previous levels by the Bulls. Once the resistance line is broken, another will be created at a higher level. The reverse holds true for a support line.
5.4 Example of Support & Resistance At Play
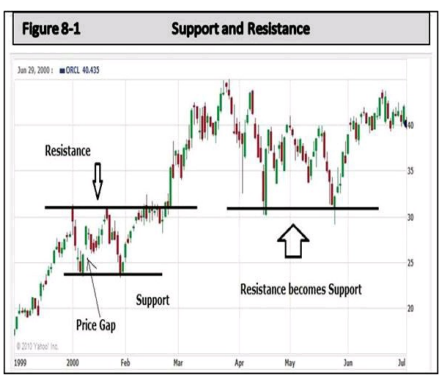
The following chart shows as the stock advanced from the left side of the chart, it hit resistance at about the 31 price range. Then as it declined, it found support at 24.00. And then, as it advanced once again it ‘bumped its head’ on resistance before falling back to support once again.
First of all, look at the first resistance level shown on the above chart at around 31. See what happened when this stock hit that resistance? It pulled back to find support at 24. It then advanced to hit resistance again, and then fell back to support.
But after hitting the support the second time, it moved through the resistance to trade higher. This is what is called a ‘Break Out,’ where the stock breaks out above a prior resistance level.
What does this tell ?
First of all, once breaking through resistance, then that prior resistance becomes support. Secondly, after breaking out above the first resistance level, we now know that this stock has two support levels. One around 31, the previous resistance, and if it fell through that one, it may find support again around 24, the old support level. This clearly shows how powerful a support level can be.
After breaking through resistance, the stock later fell back to the new support level two times, and did not fall through. What else?
Applying what we learnt so far, if you were going to purchase this stock, where would be a good entry point? When the stock traded down to support the second time? Yes. It is very common for a stock to test a support level, which this one clearly did. This forms a chart pattern known as a Double Bottom
So, yes, purchasing it in the 25 to 26 range would be a good move, and you would know there was support immediately below that level. So, given a worst case scenario, and the stock turned and started falling, you would be able to close the position (sell) for only a small loss if it fell through the support level.
A great place to have a Stop Loss for your trade would be just under the support level. Typically, a stop loss should be a few rupee lower than known support, and in this case, the stop loss would have been at about 23.50, fifty paise below the 24 known support level.
Where would be another entry point to purchase?
After it broke through resistance at 31. Knowing that there was resistance at that level, unless you purchased close to the old support level of 24 you wouldn’t be buying as it approached resistance again.
Just like we learned studying the earlier chart, if you are going to be an active participant, trading this stock, you don’t want to be the buyer when the stock is approaching a known resistance level. You would either be the seller, or you would be tightening up your Stop Loss levels to preserve gains.
In this scenario, if you had purchased the stock while it was close to the previous support and now it is trading up close to resistance, what do you do?
By purchasing around 25, you actually now have the luxury of being in a profitable position, so you have several options available:
-
You could simply sell out with a profit. But you would probably want to consider ‘Market Strength’ and other factors we will cover later before simply clicking the ‘Sell’ button
-
You could place a Stop Loss order below the current price as insurance in case the stock price dropped, you would be sold out and your profit would be protected.
-
You might simply make a ‘Mental Note’ (although mental notes are not recommended) as to where you would sell in case the price started falling so you would protect your profit, and then continue to hold the position (stock) in case of a breakout to the upside which would be even more profitable for you.


