Skip to content
Finschool By 5paisa
Menu
Courses
Blogs
Brewing
Stories
Dictionary
[searchwp_form id="1"]
En
En
हिंदी
मराठी
ગુજરાતી
Open Demat Account
Login
Courses
Blogs
Brewing
Stories
Dictionary
Open Demat Account
Follow us
Powered By NewsCanvass
Home
/
Blogs
/
Trading Different Chart Patterns
Trading Different Chart Patterns
What is Hammer Candlestick Pattern : Meaning and Types
8 Minutes
Read More
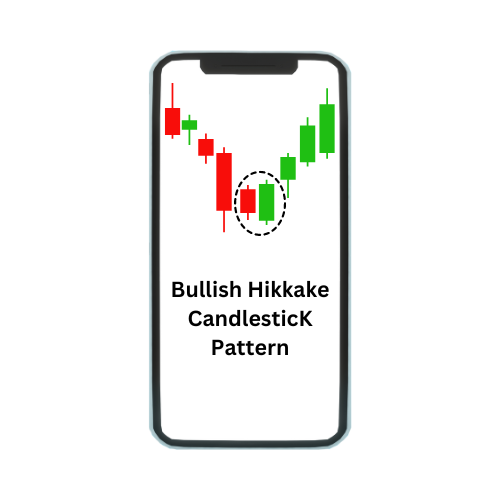
Bullish Hikkake Candlestick Pattern
7 Minutes
Read More
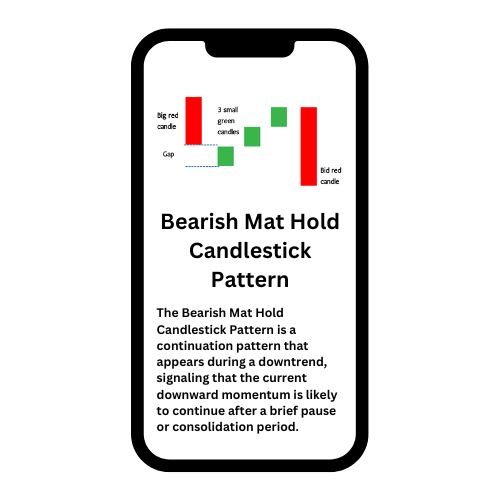
Bearish Mat Hold Candlestick Pattern
17 Minutes
Read More
Dragonfly Doji Candlestick Pattern
11 Minutes
Read More
Rising Window Candlestick Pattern
11 Minutes
Read More
Mat Hold Candlestick Pattern
12 Minutes
Read More
High Wave Candlestick Pattern
10 Minutes
Read More
Downside Tasuki Gap
8 Minutes
Read More
Falling Window
9 Minutes
Read More
Tweezer Top
10 Minutes
Read More
Bearish Harami Candlestick Pattern: Meaning & Psychology
9 Minutes
Read More
Black Marubozu
6 Minutes
Read More
Bullish Counterattack
5 Minutes
Read More
Upside Tasuki Gap
11 Minutes
Read More
Three Outside Down Pattern
9 Minutes
Read More
Rising Three Methods
12 Minutes
Read More
Bearish Counterattack
10 Minutes
Read More
Falling Three Method
9 Minutes
Read More
On Neck Pattern
5 Minutes
Read More
Three Outside Up Pattern
7 Minutes
Read More
Bullish Harami Candlestick Pattern
6 Minutes
Read More
White Marubozu
6 Minutes
Read More
Three White Soldiers
6 Minutes
Read More
Ascending Triangle Pattern – Meaning, Features and How to trade
6 Minutes
Read More
35 Types of Candlestick Patterns For Intraday Trading
16 Minutes
Read More
Williams %R Indicator: Meaning, Formula & Benefits
8 Minutes
Read More
On Balance Volume (OBV) Indicator: Meaning ; Calculations
4 Minutes
Read More
Commodity Channel Index (CCI) Indicator: Meaning, Benefits & Its Use in Stock Market
9 Minutes
Read More
Keltner Channel Strategy: Meaning, Methods & Limitations
4 Minutes
Read More
Trix Indicator: Meaning, Calculations & Limitations
4 Minutes
Read More
ADX Indicator: Average Directional Index Strategy & Formula|
11 Minutes
Read More
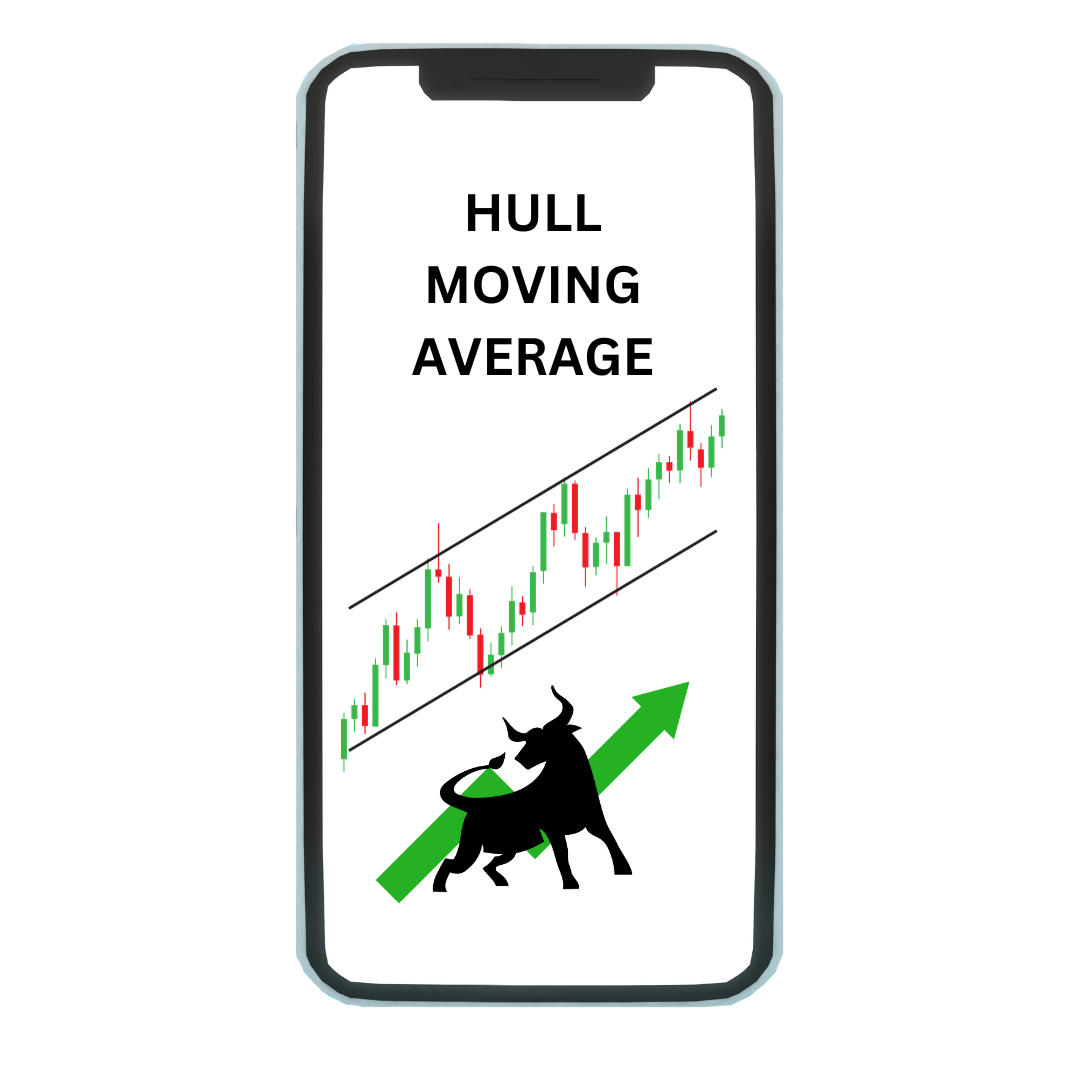
Hull Moving Average: Meaning, Calculation & Limitations
8 Minutes
Read More
Dark Cloud Cover Pattern: Meaning, Example & How to Spot?
7 Minutes
Read More
What are Single Candlestick Patterns; Their Types
7 Minutes
Read More
Understanding Classic Chart Pattern & Its Types
7 Minutes
Read More
Continuation Pattern: Meaning, Types & Working
5 Minutes
Read More
Pennant Pattern: Meaning, Formation ; Key Characteristics
6 Minutes
Read More
Triple Top Pattern: Meaning, Importance; Interpretations
5 Minutes
Read More
Understanding Three Inside Up/Down Candlestick Pattern
5 Minutes
Read More
Three Black Crows Pattern: Meaning, Examples; Limitations
5 Minutes
Read More
Rounding Bottom Pattern: Meaning, Benefits; Examples
7 Minutes
Read More
Symmetrical Triangle Pattern: Meaning, Features, Example
6 Minutes
Read More
Inverted Head And Shoulder Pattern
6 Minutes
Read More
Flag Chart Pattern
7 Minutes
Read More
Forex Chart Patterns: Meaning, Types &; Trading Tips
7 Minutes
Read More
Tweezer Bottom Candlestick Pattern: Meaning &; Importance
7 Minutes
Read More
Breakout Pattern: Meaning, Strategy & Steps for Trading
7 Minutes
Read More
Stock Market Technical Indicators: Meaning & Types
9 Minutes
Read More
Price Action Pattern: Meaning, Structure & Breakouts
8 Minutes
Read More
Harmonic Patterns: Meaning, Type, Advantage &; Disadvantage
14 Minutes
Read More
Flag And Pole Pattern: Meaning, Characteristics & Types
7 Minutes
Read More
Falling Wedge Pattern: Meaning &Trading Advantages
6 Minutes
Read More
Identifying Chart Patterns In Technical Analysis
9 Minutes
Read More
Bear Flag Chart Pattern: Meaning, Benefits & Reliability
7 Minutes
Read More
Doji Candlestick Pattern: Meaning & Types Of Doji Pattern
7 Minutes
Read More
Shooting Star Candlestick Patterns: Meaning & Benefits
7 Minutes
Read More
Triangle Pattern: Meaning & Type of Triangle Pattern
8 Minutes
Read More
What are the Types Of Chart In Stock Market
7 Minutes
Read More
Inside Candle: Meaning, Types, Trading Tips & Strategies
9 Minutes
Read More
Bull Flag Pattern – Meaning & How to Trade Bullish Flag
9 Minutes
Read More
Rising Wedge Pattern: Meaning, Breakdown & Outcome
8 Minutes
Read More
Momentum Indicators : Meaning, Types & Formula
7 Minutes
Read More
Ichimoku Cloud: Meaning, Formulas & Calculation
8 Minutes
Read More
Technical Chart Analysis: Meaning & Trading Strategies
12 Minutes
Read More
Piercing Pattern: Meaning, Formation & Trading Setup
6 Minutes
Read More
Relative Strength Index (RSI) Indicator: Meanig & Importance
10 Minutes
Read More
Gravestone Doji: Meaning, Types And Limitations
7 Minutes
Read More
Descending Triangle Pattern: Meaning & How to trade
8 Minutes
Read More
ATR Indicator: Average True Range Formula & Calculation
6 Minutes
Read More
What Is Momentum In Stock Trading & its Strategies
8 Minutes
Read More
What is Marubozu Candlestick Pattern: Meaning & Examples
4 Minutes
Read More
Spinning Top Candlestick Pattern: How to trade & Examples
6 Minutes
Read More
Hanging man pattern – Meaning, Examples & Differences
7 Minutes
Read More
Bearish Engulfing Pattern: Meaning, Example & Limitations
5 Minutes
Read More
How to Trade an Inverted Hammer Candlestick Pattern?
4 Minutes
Read More
Candlestick Reversal Patterns: Meaning & Types
7 Minutes
Read More
Bullish Engulfing Pattern: Meaning, Example & Limitations
6 Minutes
Read More
Morning Star Candlestick Pattern – Meaning & Examples
6 Minutes
Read More
Technical Analysis: Understanding Moving Averages
5 Minutes
Read More