What is Hikkake Pattern?
Candlestick patterns and the Hikkake pattern are both tools used in technical analysis to interpret price movements and make trading decisions. While candlestick patterns are a broad category encompassing many different formations, the Hikkake pattern is a specific type of pattern within this category. The Hikkake Pattern is a technical analysis pattern used in trading to identify potential market reversals or continuations. The term “Hikkake” is derived from the Japanese word meaning “trick” or “trap,” which reflects the nature of the pattern. It is designed to capture traders who may have been “tricked” by a false breakout.
Candlestick patterns provide a broad framework for analyzing price movements, while the Hikkake pattern is a more specialized tool within this framework. By understanding both, traders can gain a more comprehensive view of market dynamics. Candlestick patterns offer general insights into potential market movements, while the Hikkake pattern provides a specific method for identifying and profiting from false breakouts. When used together, they can significantly enhance a trader’s ability to make informed decisions in the market.
Structure of the Hikkake Pattern:
- Inside Day: The pattern begins with an “inside day,” where the price range of the current day is within the price range of the previous day. This signals indecision in the market.
- False Breakout: The next day, there is a breakout in the opposite direction of what would be expected. For example, if traders expect a bullish breakout, the price moves downward instead, or vice versa.
- Reversal: After the false breakout, the price reverses and moves in the original expected direction. The reversal confirms the Hikkake pattern.
Types of Hikkake Patterns:
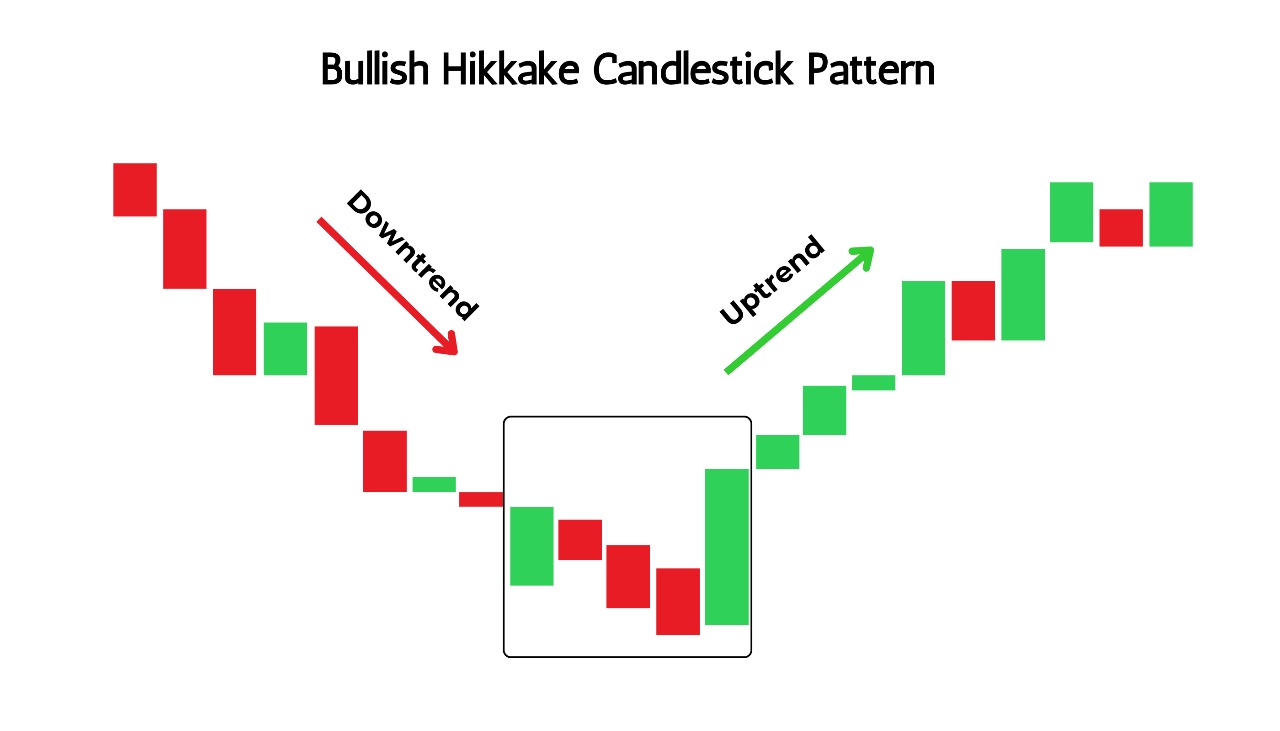
- Bullish Hikkake Pattern: Occurs when there’s a false downside breakout, followed by a reversal to the upside.
- Bearish Hikkake Pattern: Occurs when there’s a false upside breakout, followed by a reversal to the downside.
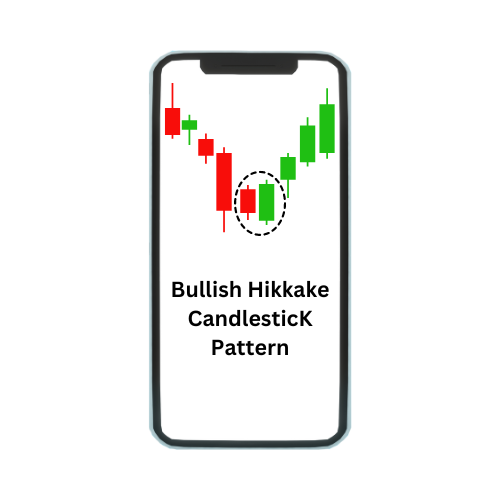
What is Bullish Hikkake Pattern?

The Bullish Hikkake Pattern is a specific type of Hikkake pattern used in technical analysis to signal a potential reversal to the upside after a false downside breakout. It is essentially a “trap” for traders who mistakenly enter short positions, expecting further downside movement, only to see the price reverse and move higher.
Structure of the Bullish Hikkake Pattern:
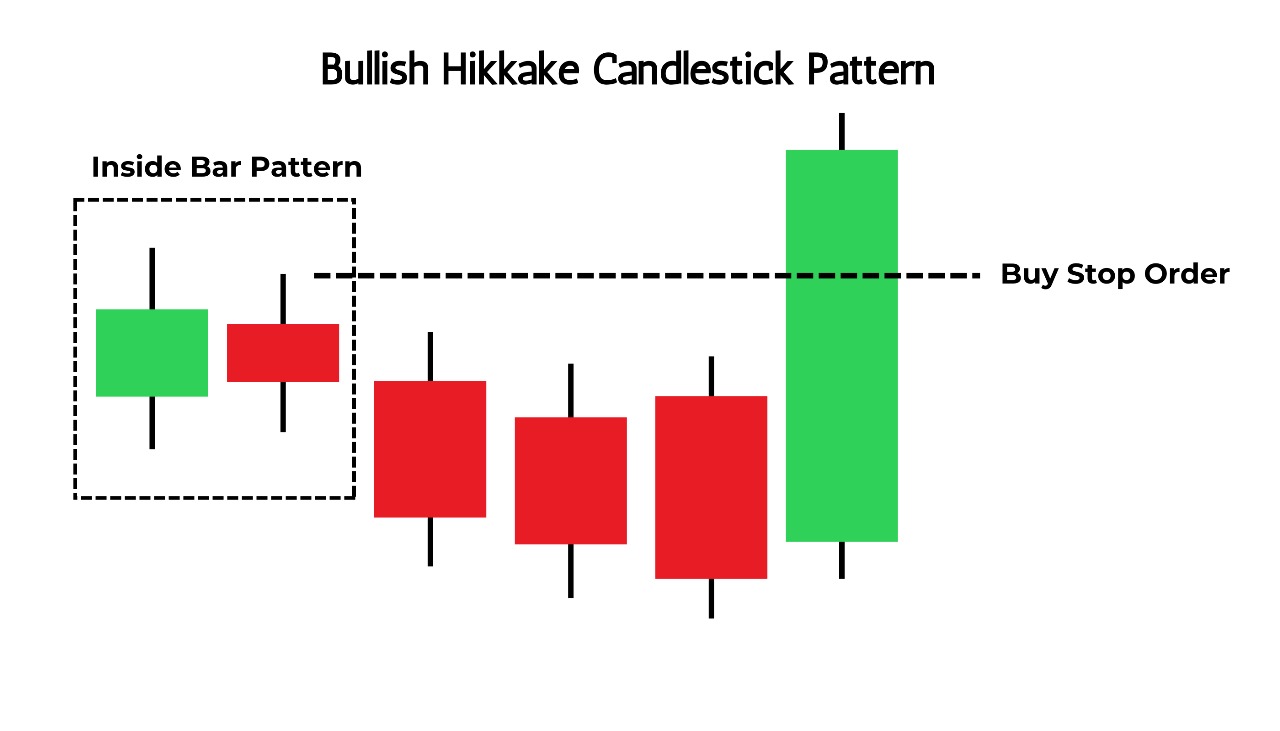
- Inside Day: The pattern starts with an inside day (or bar), where the trading range of the current day is entirely within the range of the previous day. This suggests that the market is going through a phase of consolidation and hesitation.
- False Breakout (Downside): The next day, the price breaks out of the inside day’s range to the downside, leading traders to believe that a bearish continuation is imminent. Some traders may enter short positions at this point, expecting further decline.
- Reversal (Upside): After the false downside breakout, the price reverses direction and moves back up into the original range of the inside day. This upward movement traps the traders who entered short positions, as the price continues to rise.
Understanding the Bullish Hikkake Pattern
- Market Indecision (Inside Day):
- The pattern begins with an “inside day,” where the price action is confined within the high and low of the previous day. This shows that the market is in a state of indecision, with neither buyers nor sellers able to push the price beyond the previous day’s range.
- False Breakout (Bear Trap):
- The following day, the price breaks below the low of the inside day, creating what appears to be a bearish signal. Traders might interpret this as a continuation of a downward trend and may enter short positions, anticipating further declines. However, this breakout is false, meaning it doesn’t lead to sustained downward movement. Instead, it traps the sellers who acted on this bearish signal
- Reversal and Recovery:
- After the false breakout, the price reverses direction and moves back into the range of the inside day. This reversal catches the traders who went short, forcing them to cover their positions as the price rises.
- The upward momentum continues, often leading to a sustained bullish move. This reversal is the key feature of the Bullish Hikkake Pattern, signaling a potential buying opportunity.
How to Identify a Bullish Hikkake Pattern:
- Day 1 (Inside Day): The day’s high and low are within the high and low of the previous day. For example, if the previous day’s range was ₹50 (high) to ₹48 (low), the inside day’s range might be ₹49.50 to ₹48.50.
- Day 2 (False Breakout): The price breaks below the inside day’s low but fails to sustain the downward move. For instance, the price might dip to ₹47.50 but then starts to rise again.
- Day 3 (Reversal): The price moves back into the range of the inside day, signaling the reversal. A break above the inside day’s high (₹49.50) would confirm the bullish reversal.
Interpreting the Bullish Hikkake Pattern
- Entry Point: Traders usually enter a long position when the price breaks back above the high of the inside day, confirming the bullish reversal. This might occur on the day of the reversal or on a subsequent day.
- Stop Loss: To manage risk, a stop-loss order is typically placed just below the low of the false breakout day. This limits potential losses if the reversal fails to hold.
- Profit Target: The profit target can be set based on the initial range of the inside day or by using other technical analysis tools such as moving averages or resistance levels.
Importance and Reliability:
- The Bullish Hikkake Pattern is considered reliable in markets that tend to consolidate before making significant moves. It is especially useful when identified near key support levels, as it can indicate that a downward move has exhausted and buyers are regaining control.
- However, like all technical patterns, it is not fool proof. Traders often combine the Bullish Hikkake Pattern with other indicators or analysis methods to confirm its validity and increase the chances of a successful trade.
Bullish continuation signal
The bullish Hikkake pattern suggests that a rising market might continue to rise, so you might want to take that prediction seriously. Make sure the trend is still current, though, and not just a long-term one that might end at any time. When trading this signal, you should place your buy order at the close of the breakout candlestick, which is the candlestick that completes the pattern by breaking above the high of the inside bar. Alternatively, when the false downward breakdown reverses, place a buy-stop order slightly above the high of the inside bar. Your profit target should be just before the next resistance level or a 2:1 reward/risk ratio, and your stop loss should be below the pattern’s lowest point.
Pullback reversal signal
In this case, you want to trade the end of a protracted downtrend’s reversal. A Fibonacci retracement level, a trend line, a long-period moving average, or a support level should be the formation points for the bullish Hikkake pattern. When the false downward breakdown reverses, place your buy order at the close of the breakout candlestick, or place a buy-stop order slightly above the high of the inside bar. Position your take-profit just in front of the subsequent resistance level, and place your stop loss below the pattern’s lowest point.
The limitations of the bullish Hikkake pattern
As with other candlestick patterns, the bullish Hikkake pattern has some limitations but, when traded in the right market conditions with the right tools, it provides a good trading signal. One of them is that it should not be traded alone; although the pattern clearly defines the entry point and stop loss, you are responsible for putting profit-taking measures in place because the pattern does not specify a profit target. Never assume that the price breakout will be exactly the same as you have expected it to be.
Conclusion
Thus the first trend in Bullish Hikkake is either bearish or downward. A bearish candle breaks below its low after the inside bar. Nevertheless, the price turns and closes above the high of the inside bar rather than continuing downward, suggesting a possible reversal to the upside.


