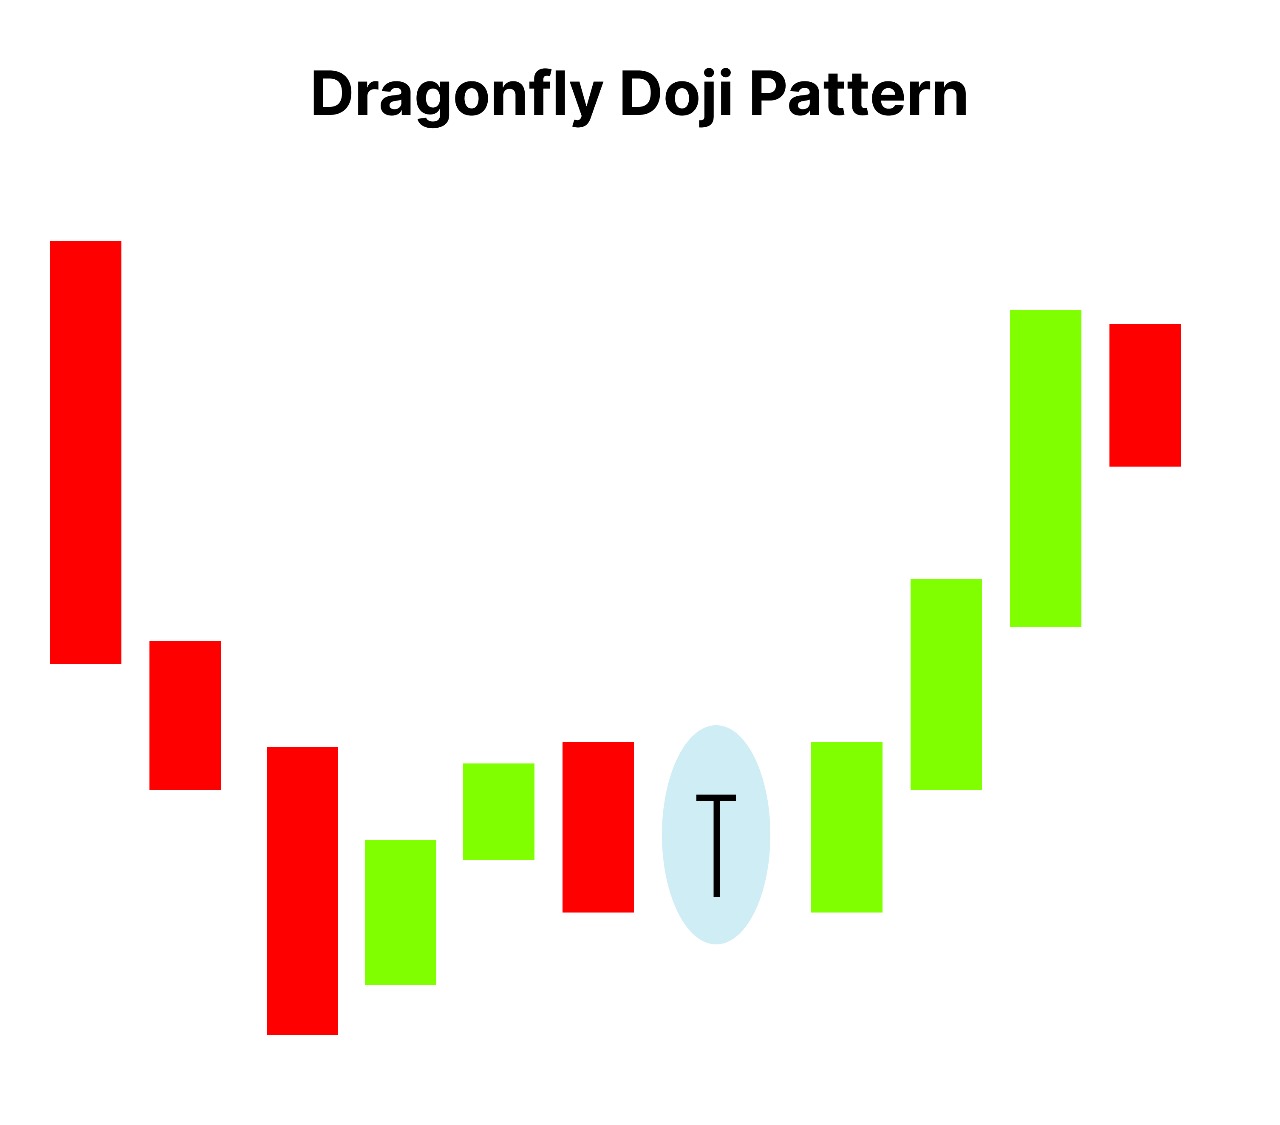
The Dragonfly Doji candlestick pattern is a unique formation that signals indecision or a potential reversal in the market, often occurring at the end of a downtrend. It is characterized by a long lower shadow, with the open, close, and high prices nearly equal, forming a “T” shape. The long lower shadow indicates that sellers dominated early in the session, but buyers regained control, pushing the price back up. This pattern suggests a possible shift in market sentiment, and traders often look for bullish confirmation in the following candlestick to validate a reversal signal.
What is Dragonfly Doji Candlestick Pattern
The Dragonfly Doji is a type of Doji candlestick pattern that signals potential reversal in the market, especially at the end of a downtrend. It is characterized by a long lower shadow, no (or very small) upper shadow, and the open, close, and high prices being very close to one another, resulting in a “T-shaped” candle.
Structure of Dragonfly Doji Candlestick Pattern

The Dragonfly Doji candlestick pattern has a distinct structure that makes it easily recognizable on price charts.
Open Price:
The price at which the asset opens for the trading session. In a Dragonfly Doji, the opening price is typically very close to the closing price.
Close Price:
The price at which the asset closes at the end of the trading session. For a Dragonfly Doji, the close is near or at the same level as the open price.
Long Lower Shadow:
- The most defining characteristic of the Dragonfly Doji is its long lower shadow. This shadow indicates that the price initially fell significantly during the session but rebounded to close near the opening level.
- The length of the lower shadow should be at least twice the length of the body (the area between the open and close prices).
No (or Very Small) Upper Shadow:
- A true Dragonfly Doji features little to no upper shadow. This lack of an upper shadow suggests that the price did not rise significantly above the opening level during the session.
- If there is a very small upper shadow, it should not be more than a few ticks.
Body Size:
- The body of the Dragonfly Doji is typically very small, as the open and close prices are very close together. This results in a candlestick that looks like a “T” or a cross.
- The colour of the body (green or red) may vary, but the focus is primarily on the formation rather than the colour.
Understanding the Dragonfly Doji Candlestick
Shape: The Dragonfly Doji has a very small or non-existent body, with a long lower shadow and no upper shadow. The candle resembles a “T,” with the open, high, and close prices almost identical.
Formation: This pattern forms when the price opens at a certain level, drops significantly during the trading session, and then rallies back up to close at or near the opening price. The absence of an upper wick indicates that buyers could maintain the upward momentum without resistance.
Location and Context:
- Bullish Reversal: When seen at the end of a downtrend, it often hints at a potential bullish reversal. It suggests that sellers were initially in control, but the strong comeback by buyers indicates a shift in sentiment.
- Sideways Trend: When a Dragonfly Doji appears in a sideways or ranging market, it signals indecision, as neither buyers nor sellers have the upper hand.
Psychological Insight:
The Dragonfly Doji reflects a tug-of-war between buyers and sellers. The long lower shadow shows that the sellers managed to push the price significantly lower during the session. However, the buyers stepped in, reversing the losses and driving the price back up to the opening level. This change in power dynamics can be a precursor to an uptrend if followed by a bullish confirmation.
Trading the Dragonfly Doji:
- Confirmation Candle:
To act on the Dragonfly Doji, traders typically wait for a confirmation candle. This is usually a bullish candle with a strong close above the Dragonfly Doji’s high, indicating the start of a potential uptrend.
- Entry and Exit Strategies:
- Entry: Enter a long position after a bullish confirmation candle closes above the Doji.
- Stop Loss: Place a stop loss below the Dragonfly Doji’s low to limit risk in case the pattern fails.
- Target: The initial profit target is set based on the nearest resistance level or using a risk-reward ratio (e.g., 1.5x or 2x the risk).
- Volume Analysis:
- Increased volume during the formation of a Dragonfly Doji enhances its significance. High volume indicates that the reversal is supported by strong buying interest, making it a more reliable signal.
Key Considerations:
- Reliability: The Dragonfly Doji’s predictive power increases when found at support levels or at the bottom of a trend. In the middle of a trend, it may signal a pause rather than a reversal.
- Market Context: Always analyze the broader market context, such as trend strength, volume, and external factors, before taking a position based on this pattern.
What does Red Dragonfly Doji Candlestick mean??
A Red Dragonfly Doji is a variation of the standard Dragonfly Doji candlestick, where the open price is higher than the close price, resulting in a red or bearish candlestick.
Despite this slight bearish closing, the pattern still holds the same core structure and meaning as the traditional Dragonfly Doji, with a long lower shadow and no upper shadow, indicating market indecision or a potential reversal.
Key Characteristics:
- Red Colour: The red colour simply indicates that the candle closed slightly lower than it opened. However, this difference is minimal, as the open and close prices are still very close to each other, justifying its classification as a Doji.
- Long Lower Shadow: Like a regular Dragonfly Doji, the long lower shadow shows that sellers dominated earlier in the session by pushing the price significantly lower, but buyers fought back to bring it near the opening level by the close.
Interpretation of a Red Dragonfly Doji:
- Potential Reversal Signal: Even though the candle closes lower, the fact that buyers managed to recover from a deep dip suggests that selling pressure may be weakening. This can indicate a potential bullish reversal, especially at the end of a downtrend.
- Confirmation Needed: A red Dragonfly Doji, like other Doji’s, requires confirmation from the following candle. Traders typically look for a bullish candle after the Red Dragonfly Doji to confirm the reversal.
A Green Dragonfly Doji is a specific type of candlestick pattern that signifies potential bullish reversal and market indecision.
Characteristics of a Green Dragonfly Doji:
- Candle Structure:
- Green Body: The candlestick closes higher than it opens, resulting in a green (bullish) body. This indicates that buyers managed to push the price slightly above the opening level by the end of the session.
- Long Lower Shadow: The long lower shadow demonstrates that sellers initially pushed prices significantly lower during the trading session, but buyers stepped in to regain control and drive the price back up.
- No Upper Shadow: The absence of an upper shadow suggests that prices did not rise significantly above the opening level during the session.
- Formation Context:
- The Green Dragonfly Doji typically appears at the end of a downtrend, indicating a possible reversal.
Interpretation:
- Bullish Reversal Signal: The formation suggests that the selling pressure is weakening, and buyers are beginning to dominate. The green color indicates that buyers were able to close the price higher than where it opened, reflecting renewed buying interest.
- Indecision: Despite the positive close, the long lower shadow emphasizes that there was significant selling pressure earlier in the session, leading to indecision in the market.
How effective is a Dragonfly Doji Candlestick in Technical Analysis?
- The Dragonfly Doji is a notable candlestick pattern in technical analysis that can be effective for traders, particularly when used in the right context and alongside other tools
- Combine with Other Indicators: Use additional technical analysis tools, such as moving averages, RSI, or MACD, to confirm the signal provided by the Dragonfly Doji.
- Consider Volume: High trading volume during the formation of the Dragonfly Doji can enhance its significance, indicating strong buyer interest.
- Look for Support Levels: The pattern is more effective when it appears near established support levels, further increasing the likelihood of a reversal.
Benefits of Dragonfly Candlestick pattern
- Reversal Signal: The Dragonfly Doji is commonly seen as a bullish reversal pattern when it appears at the end of a downtrend. It indicates potential indecision in the market, suggesting that buyers may be regaining control after a period of selling.
- Psychological Insight: The pattern captures market sentiment by demonstrating the struggle between buyers and sellers. The long lower shadow signifies that sellers initially pushed prices down, but the recovery towards the opening price reflects renewed buying interest.
- Visual Clarity: The distinct “T” shape makes the Dragonfly Doji easy to identify on charts. Its visual representation aids traders in quickly spotting potential reversal points.
- Versatile Usage: The pattern can be applied across various timeframes and assets, including stocks, forex, and commodities. This versatility makes it valuable for different trading styles, whether day trading or long-term investing.
Limitations of Dragonfly candlestick pattern
- Need for Confirmation: The Dragonfly Doji alone is not a guaranteed reversal signal. Traders often require confirmation from subsequent price action, such as a bullish candle, to validate the reversal before entering trades.
- Context Matters: The effectiveness of the Dragonfly Doji depends on its location within the trend. For example, if it appears in a strong downtrend without any support level nearby, the likelihood of a reversal may be reduced.
- False Signals: Like many candlestick patterns, the Dragonfly Doji can produce false signals, especially in volatile markets or when combined with low trading volume. Traders need to be cautious and use additional indicators to confirm the pattern’s reliability.
- Market Conditions: In highly trending or momentum-driven markets, reversal patterns, including the Dragonfly Doji, may be less reliable. It’s essential to assess the broader market context before acting on the signal.
What is Dragonfly Candlestick used for??
The Dragonfly Doji candlestick pattern is primarily used in technical analysis for several key purposes, particularly in identifying potential market reversals and gauging trader sentiment. Here are the main uses:
- Identifying Potential Reversals:
- Bullish Reversal: The Dragonfly Doji is often seen as a signal for a potential bullish reversal, especially when it forms at the end of a downtrend. It indicates that selling pressure may be weakening and that buyers are stepping in.
- Market Indecision: The pattern reflects indecision in the market, where sellers initially pushed prices lower, but buyers fought back, resulting in a close near the opening price.
- Entry and Exit Signals:
- Long Entry Point: Traders may use the Dragonfly Doji as a trigger to enter long positions, particularly when followed by a bullish confirmation candle that closes above the high of the Doji.
- Setting Stop Losses: The low of the Dragonfly Doji can be a logical place to set stop-loss orders, helping to manage risk in the event that the reversal does not occur.
- Support and Resistance Levels:
- Support Identification: When a Dragonfly Doji forms near a significant support level, it can enhance the likelihood of a price bounce, providing traders with a key reference point for potential entries.
- Resistance Levels: In cases where the pattern appears near resistance levels, it may also indicate potential selling pressure and the need for caution in long positions.
- Market Sentiment Analysis:
- Psychological Indicator: The Dragonfly Doji captures the struggle between buyers and sellers, reflecting market sentiment. A strong recovery from a downtrend suggests that buyers may be gaining confidence.
- Trend Assessment: The appearance of a Dragonfly Doji can lead traders to reassess the strength of the current trend, considering potential reversals or continuations based on the subsequent price action.
- Part of Candlestick Patterns:
- Pattern Recognition: The Dragonfly Doji can be part of a larger candlestick pattern or series, providing context for further analysis. For example, multiple Doji candles in sequence can signify prolonged indecision or consolidation before a breakout.
- Integration with Other Technical Tools:
- Combining Indicators: Traders often use the Dragonfly Doji in conjunction with other technical indicators (like moving averages, RSI, or Fibonacci retracements) to enhance decision-making and confirmation of signals.
Conclusion
The Dragonfly Doji is a versatile candlestick pattern used for identifying potential bullish reversals, assessing market sentiment, and guiding entry and exit strategies in trading. While it is a valuable tool, traders should seek confirmation from subsequent price action and consider other technical factors for effective decision-making.