The morning star and evening star patterns are three candlestick patterns that signal potential market reversals. The morning star pattern is a bullish reversal pattern, typically appearing at the end of a downtrend, while the evening star pattern is bearish, forming at the peak of an uptrend. A bullish reversal candlestick pattern signals a potential change in market sentiment, where the price may transition from a downward trend (bearish) to an upward trend (bullish). These patterns typically reflect strong buying pressure after a period of selling, indicating that buyers are gaining control and the asset’s price could rise. Both patterns consist of three candles: the first indicates the prevailing trend (bullish for evening star, bearish for morning star), the second shows indecision with a small body, and the third confirms the reversal with a strong move in the opposite direction. These star candlestick patterns are widely used in technical analysis to predict price movements and are considered reliable indicators when confirmed by other factors like volume or trendlines. Let us understand Morning Star candlestock pattern in detail
Introduction To Morning Star Candlestick Pattern:
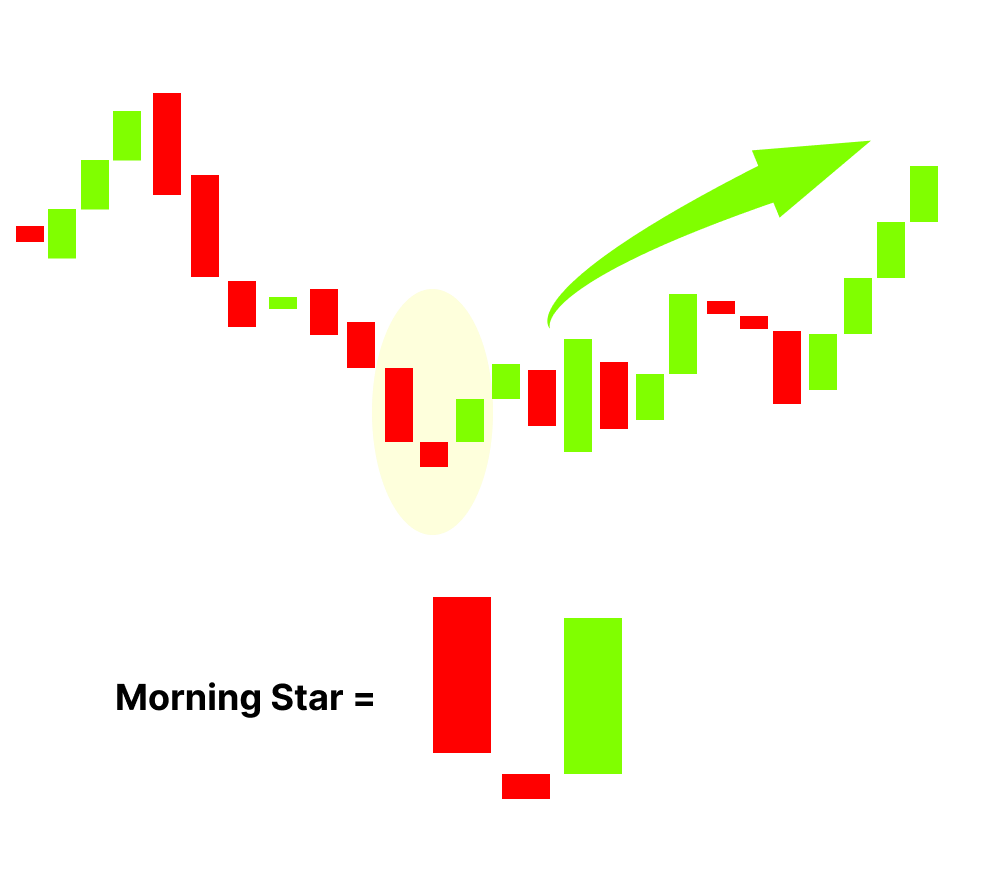
- There are no specific calculations to make because a morning star simply a visual pattern. A morning star is a three-candle pattern in which the second candle contains the low point. The low point, however, is not visible until the third candle has closed.
- A morning star pattern consists of three candles, with the low point occurring in the second candle. The low point, however, is not visible until the third candle has closed.
What is the Morning Star candlestick Pattern?
- A trader generally seeks to witness rising volume over the course of the pattern’s three sessions, with the third day showing the highest volume. Regardless of other signs, high volume on the third day is frequently regarded as a confirmation of the pattern (and a future upswing). As the morning star forms in the third session, a trader will take a bullish position in the stock, commodity, pair, etc. and ride the uptrend until there are signs of another reversal.
How to Identify Morning Star Candlestick Patterns?
- The bears have complete control of the market because it is in a decline. During this time, the market consistently hits new lows.
- The market makes a new low on day 1 of the pattern (P1), as predicted, and a lengthy red candle forms. The large red candle indicates an increase in sales
- The bears demonstrate their supremacy with a gap down opening on pattern day 2 (P2). This confirms the bears’ position.
- Following the gap down opening, there isn’t much activity during the day (P2), which either produces a doji or a spinning top. The appearance of a doji or spinning top should be noted as a sign of market uncertainty.
- The bears become a little agitated when a doji or spinning occurs since they would have otherwise anticipated another down day, especially in light of the positive gap down opening.
- The market or stock opens with a gap up on the third day of the pattern (P3), which is followed by a blue candle that closes above the red candle’s opening on P1.
- If P2’s doji/spinning top had not developed, P1 and P3 would have appeared to have produced a bullish engulfing pattern.
- P3 is the hub of all the action. The bears would have been a little uneasy when the gap up first opened. Encouraged by the gap up opening, buying continues throughout the day, recovering all of P1’s losses.
- One should search for purchasing chances in the market as it is anticipated that the bullishness on P3 will likely remain for the upcoming trading sessions.
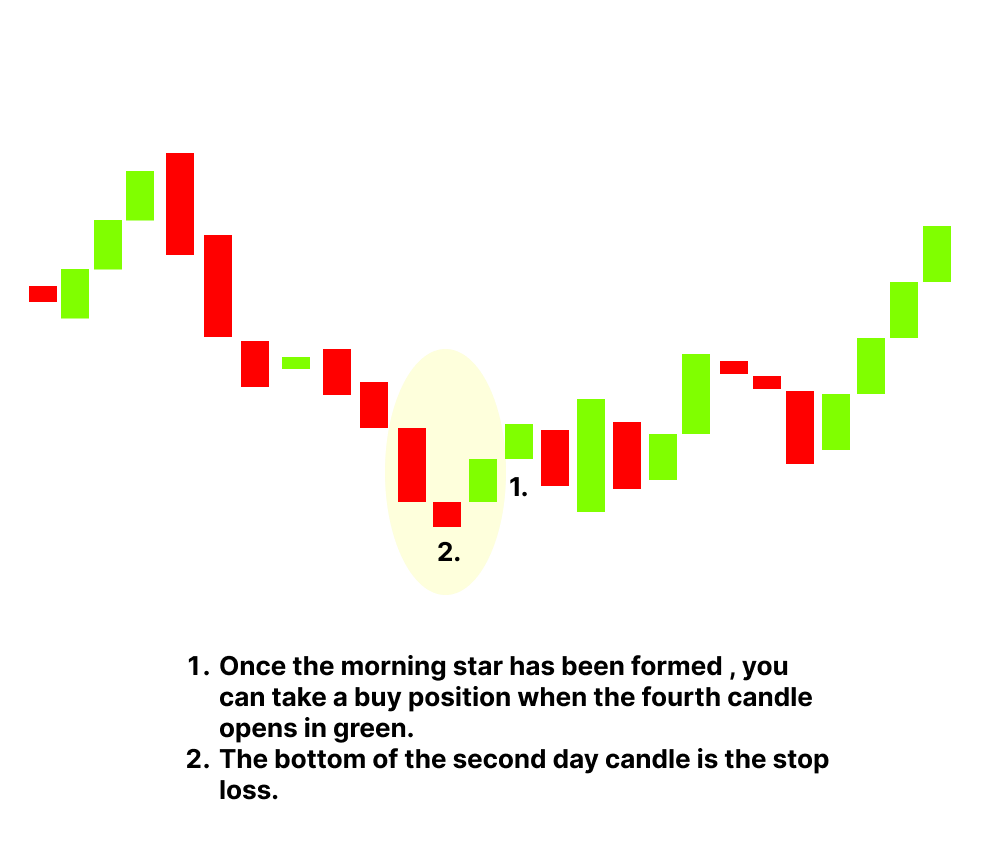
Unlike the single and two candlestick patterns, the trade can be opened on P3 itself by both risk-taking and risk-averse traders. Trading based on a morning star pattern may not require waiting for a confirmation on the fourth day.
Example of How to trade a Morning Star Candlestick?
- Three candlesticks make up a three-day bullish reversal pattern, which will resemble the following: The first is a long-bodied red candle that continues the decline that is currently in place. A short middle candle that gaps down on the open follows next. Following is a green candle with a long body that gaps up at the open and closes above the first day’s body’s halfway. At about 3480 INR, the TCS chart begins to create a Morning Star pattern; from there, it starts to go upward, changing the trend from negative to bullish.
The Difference Between a Morning Star Candlestick and a Doji?
- There is a slight variance in the morning star pattern. A Doji is formed when the middle candlestick’s price action is essentially flat. This is a little candlestick, like the plus symbol, with no discernible wicks. The Doji morning star more strongly illustrates the market’s ambiguity than a morning star with a thicker middle candle.
- Due to more traders being able to clearly witness a morning star-forming candle, the development of a Doji following a black candle will typically see a more aggressive volume increase and a correspondingly longer white candle.
The difference between a morning star and an evening star?
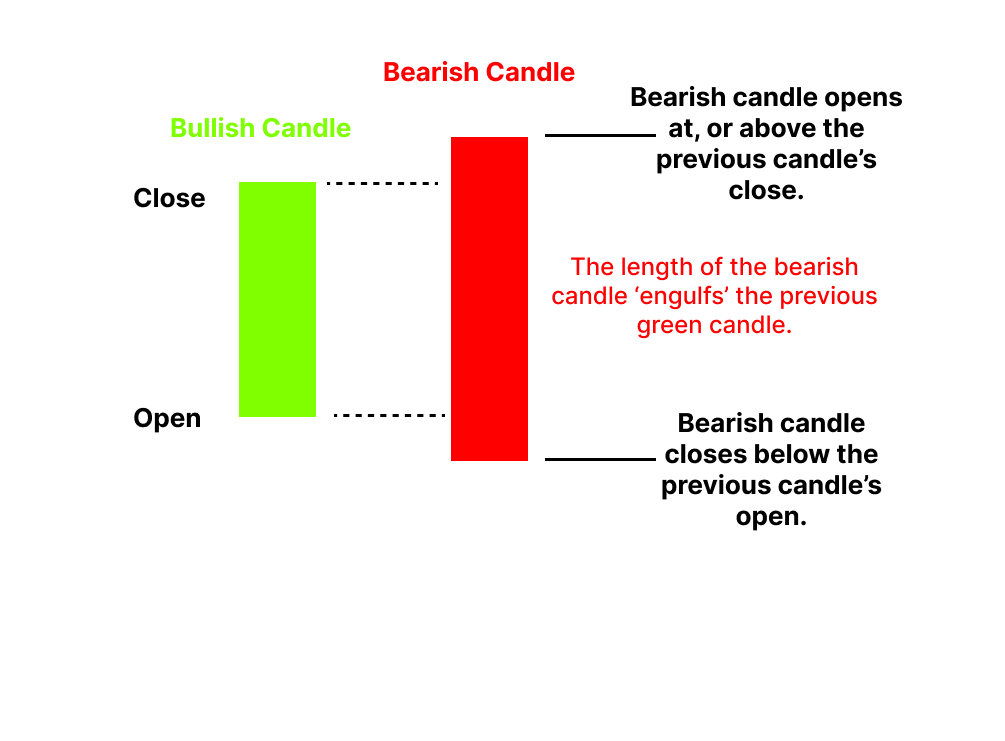
- Of course, an evening star is the opposite of a morning star. The evening star is composed of a long white candle that is followed by a small black or white candle that is at least half as long as the white candle in the opening session, and finally a long black candle. An uptrend is about to reverse, with the bull giving way to the bears, according to the evening star. A bearish counterpart to the morning star is the evening star. At the peak of an upward trend, the evening star appears. The evening star also has three candles and develops across three trading sessions, just like the morning star.
Conclusion
- The best morning stars are those that are supported by volume and another sign, such as a support level. Otherwise, anytime a little candle appears in a downtrend, it is quite simple to notice morning stars forming. Other technical indications, such as whether or not the price movement is approaching a support zone or whether or not the relative strength indicator (RSI) is indicating that the stock or commodity is oversold, might aid in determining whether a morning star is forming.
- Want to learn more about technical analysis read more..


